
Introduction to the Console Window
Tutorial
Beginner
+10XP
10 mins
(357)
Unity Technologies
The Console Window is an incredibly useful tool to aid in debugging your projects and finding where the problems within your scripts lie. In this tutorial, you'll learn how to use the Console Window and understand the information displayed there.
Languages available:
1. Intro the The Console Window
2. What is the Console Window?
This tutorial has been verified using Unity 2019 LTS
The Console Window is an incredibly useful tool to aid in debugging your projects and finding where the problems within your scripts lie. It’s an essential tool that any developer should make full use of as it will ease many of the pains while speeding up the debugging process, especially when your project contains thousands of lines of code and many scripts. Getting into the habit of utilizing the Console Window during development will only benefit the developer.
In the Console Window, you will find where errors and warnings are along with the potential reasons. It is also used to aid with debugging by creating your own messages within the scripting language (Figure 01).
3. Opening the Console Window
First, let us take a look at the console window toolbar. It can be opened several ways.
1. From the top dropdown menu, select: Window > General > Console
2. Press Ctrl+Shift+C on Windows, or Command+Shift+C on MacOS
The Console Window is a dockable window and will preserve its state between sessions (Figure 01). The Console window will have a toolbar where you can adjust how it displays its messages (Figure 02).
The Console window toolbar lets you choose options in how the messages are displayed. Starting from left to right:
- Clear: Removes any messages generated from your code but it retains any compiler errors.
- Collapse: This toggles how the messages are displayed, when turned on it will only display the first instance of an error message that keeps recurring. This is useful for runtime errors that are sometimes generated identical on each frame update.
- Clear On Play: Toggling this button will enable the window to be cleared, much like the Clear button, every time you run the game.
- Clear On Build: Toggling this button will enable the window to be cleared, much like the Clear button, every time you build a project.
- Error Pause: This option will cause the playback of the game to be paused whenever Debug.LogError is called from a script. Please note that Debug.Log will not pause the playback in this way.
- Editor: This drop-down reveals four more options for viewing additional information about errors. The Player Logging, Full Log, Editor, and <Enter IP> on the Console tab menu access Unity’s log files, which record details that may not be shown in the console (Figure 03).
- Message Counts: In the far right of the toolbar, you’ll notice three symbols, a talking bubble, a hazard sign, and a stop sign. These correlate to how many messages have been sent to the Console window. In addition if you select one of them, you can toggle displaying those types of messages in the Console window. The talking bubble represents general messages, the hazard sign represents warnings and the stop sign represents error messages.
4. Scripting your Own Messages
The code to display your own messages to the Console window can be done in three different ways, one to generate a regular message, to display a warning, and then finally to display an error (Figure 04).
1. Create a new script and name it ‘Sample Debug’.
2. Create a GameObject in your scene and attach the script to it.
3. Once that is done, open the script in your preferred editor.
4. Debug messages can be displayed anywhere, so we’re simply going to place Debug.Log(“Hello World”); in the Start() function of the script.
5. Select Play in the Unity Editor, the debug message will display once. Moving that line of code to the Update() function will cause the debug message to be logged every frame.
These commands can exist within any function you create and will be called and logged when it’s executed.
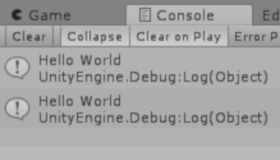
When the code in the script is attached to a GameObject while the game is running it will generate messages in the Console window. You will notice that “Hello World” appeared twice, one with a single call, while the other is continually updating every frame. Make sure your Collapse button is toggled to have a duplicated message stack with a number count to the right of the message (Figure 05).
5. Console Window Properties
The Console Window will also display warnings from Unity about the usage of obsolete API calls in your code. When obsolete API calls are detected, Unity will show a warning message about each one. The additional feature of these warnings is that if you double-click the message Unity will attempt to upgrade the deprecated code to a recommended one automatically.
To adjust the number of lines, or granularity, that the log entry displays in the Console window:
1. Right-click the Console window’s Menu in the upper-left corner of the window (Figure 06).
2. Select the Log Entry submenu.
3. Choose the number of lines you wish to see.
6. Console Window Stack Tracing
You can also specify how accurate the stack tracing should be when the Console window captures a log message. Stack tracing or a stack trace is a report of the active stack frames at a certain point in time during the execution of the project. This is especially helpful when the error message may not be very clear. By looking at the stack trace you can deduct from what engine area the error appears.
For example, when running a project, a bug could be buried in a script that is related to the current operation such as an item being deleted when you move it around in your inventory. The most immediate suspect would be the inventory system, but in fact it is a bug that is nestled in code that manages the object a few steps below the Layer. A stack trace would give you the path of execution that you can follow to find all components that are being run at the time of the bug. Having this path visible enables you to follow the sequence of events and is incredibly helpful in resolving issues within your project (Figure 07).
You have three options you can set for Stack Trace Logging:
- None: Stack traces won’t be printed. This is the default case and will only display the error in question. This is the fastest and least resource intensive option, useful when you are debugging simple scripts and are manually sending debug messages.
- ScriptOnly: Only a managed Stack Trace will be printed. This will be useful in more robust scripts that are self-contained. It will help direct you to the exact location where an error is appearing.
- Full: Both a native and managed Stack Trace will be printed. It should be noted that resolving a full Stack Trace is an expensive operation and should only be used for debugging purposes of complex systems where it will be harder to ascertain where an error is appearing.
7. Conclusion
Now that you’ve worked with the Console window, getting into the habit of utilizing its features and what you have learned will be the next step in expanding your skills as a developer and being able to troubleshoot yours or others’ projects. It is a vital skill for any developer to have and will only benefit you in the long run. Be sure to utilize the Console window and the ability to generate your own debugging messages in your future projects.