
UI Profiler
Tutorial
intermediate
+10XP
20m
(85)
Unity Technologies
In this tutorial, you will learn how to use the Profiler to diagnose performance issues in your UI.
Languages available:
1. UI Profiler
Verified with: 2019.4
Verified with: 2019.3 - https://learn.unity.com/tutorial/ui-profiler-2019-3
The UI Profiler helps take the guesswork out of diagnosing performance issues with your projects. If your projects are running slow and you don’t know why, the Profiler is a good place to start.
Let’s try out the Profiler using an interface that has a mix of static and dynamic elements. The static elements include the menu and drop-down options. The dynamic element is the clock in the lower right of the screen (Figure 01).
1. To access the Profiler, navigate to Window > Analysis > Profiler.
This can appear a bit overwhelming at first, so we’ll filter the Profiler to display only the graphs related to our UI.
2. In the upper-left corner, navigate to Profiler Modules and click the drop-down. Uncheck everything but CPU, UI, and UI Details. The Profiler should now be a lot cleaner (Figure 02).
The graphs in the UI section show the time spent computing Layout and Rendering. The UI Details section provides important information about the batch process.
3. Click on the UI Details panel and take note of the Canvas breakdown in your Scene (Figure 03).
The most important parts of this panel are the number of batches in your Scene and the reasons elements weren’t batched together. Notice that our dynamic elements are batched separately, as the dynamic Canvas is nested under the static Canvas. This is expected behavior and actually improves performance in our Scene due to the nature of Nested Canvases in Unity. Our static elements are also batched separately, which isn’t expected behavior.
Under the Batch Breaking Reason tab, we can see that each static element is rendered separately due to having different textures. Under the GameObjects tab, you’ll find the names of the batch-breaking elements.
As these are text GameObjects, a good check would be to verify whether they’re being rendered with the legacy Text component or the newer TextMeshPro Text (UI) component.
The same principles apply to Sprite and Image assets in your Scene. It’s good practice to reference Sprites from the same Sprite Atlas when possible to reduce the number of batches. It’s also important to ensure your Sprite Atlases are of a reasonable size, and that you load only the Atlases you need for a given Scene.
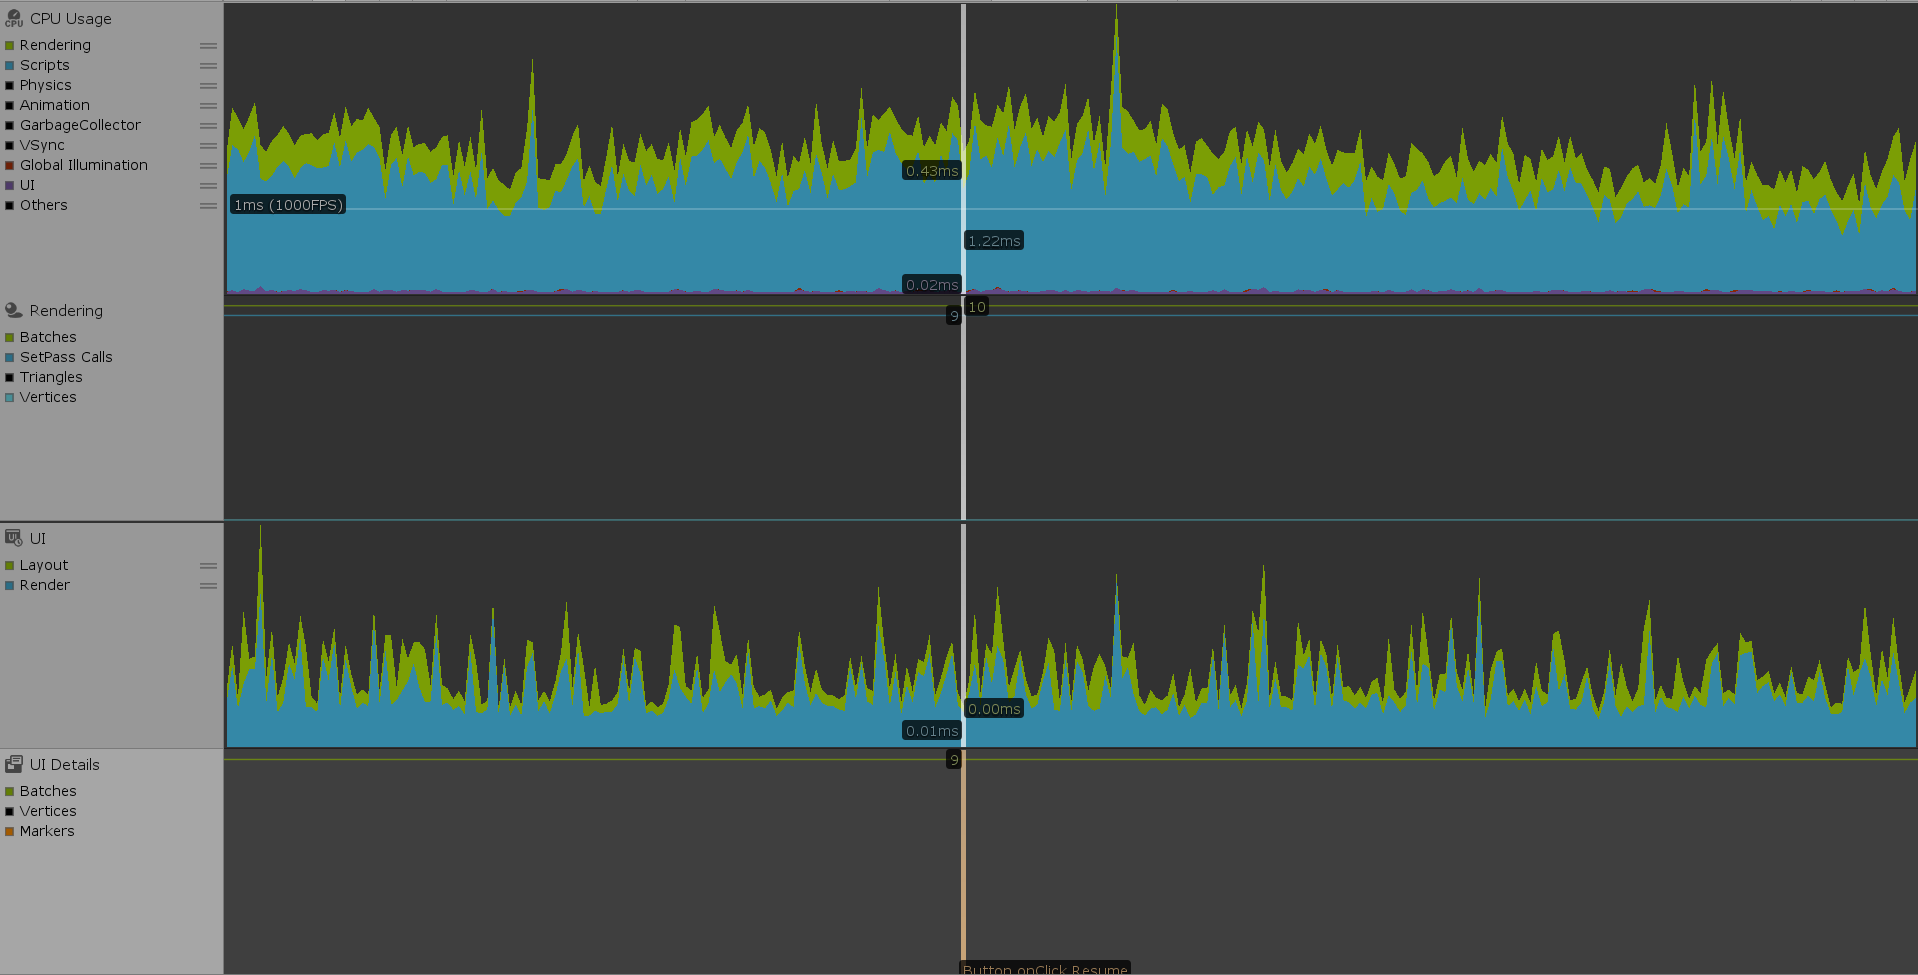
Another neat feature of the UI Details panel are Markers. Markers appear as orange spikes in the panel’s graph whenever an Event is processed by the UI. An Event can mean something as simple as a pointer hovering over a UI component or the user clicking on a component to bring up a drop-down menu.
4. Try clicking on an element in your UI. You should see a Marker appear in the UI Details panel (Figure 04).
This Marker displays a snapshot of the Layout, Rendering, and CPU processes occurring at the moment that Event was triggered. This can help users identify whether a specific Event is causing performance issues, or behaving as expected.