
Working with the Profiler Window - 2019.3
Tutorial
intermediate
+10XP
30m
(143)
Unity Technologies
The Profiler window is an incredibly powerful tool that provides detailed information on how your project is performing. During runtime, it details your project’s Central Processing Unit (CPU) usage, memory, physics, network usage and more. In this tutorial, you will learn about the Profiler window and its uses.
Languages available:
1. Introduction
If you are using Unity 2019.2 or lower, click here.
The Profiler window is an incredibly powerful tool that provides detailed information on how your project is performing. During runtime, it details your project’s Central Processing Unit (CPU) usage, memory, physics, network usage and more. If your project is experiencing problems, such as low framerate or high memory usage, the Profiler can show you what’s causing these problems and help you plan how to fix them.
2. Using the Profiler window
Using the Profiler, you can learn about different aspects of your project’s performance, such as how much memory it’s using, how much CPU time is being used for different tasks, and how frequently physics calculations are being performed. Most importantly, you can use this data to help identify performance problems.
- Open the Profiler window by going to the menu bar and clicking Window > Analysis > Profiler or Ctrl + 7 on Windows or Cmd + 7 on Mac.
- Once it’s open, run your project in the Editor window so the Profiler can begin to collect performance data from your project (Figure 02).
On the left side of the Profiler window, you’ll see a column of profilers. Each of these displays information about a specific aspect of your project. There are different profilers for CPU usage, Graphics Processing Unit (GPU) usage, rendering, memory usage, audio, physics, and networking.
The bottom half of the Profiler window displays detailed information from the currently selected profiler.
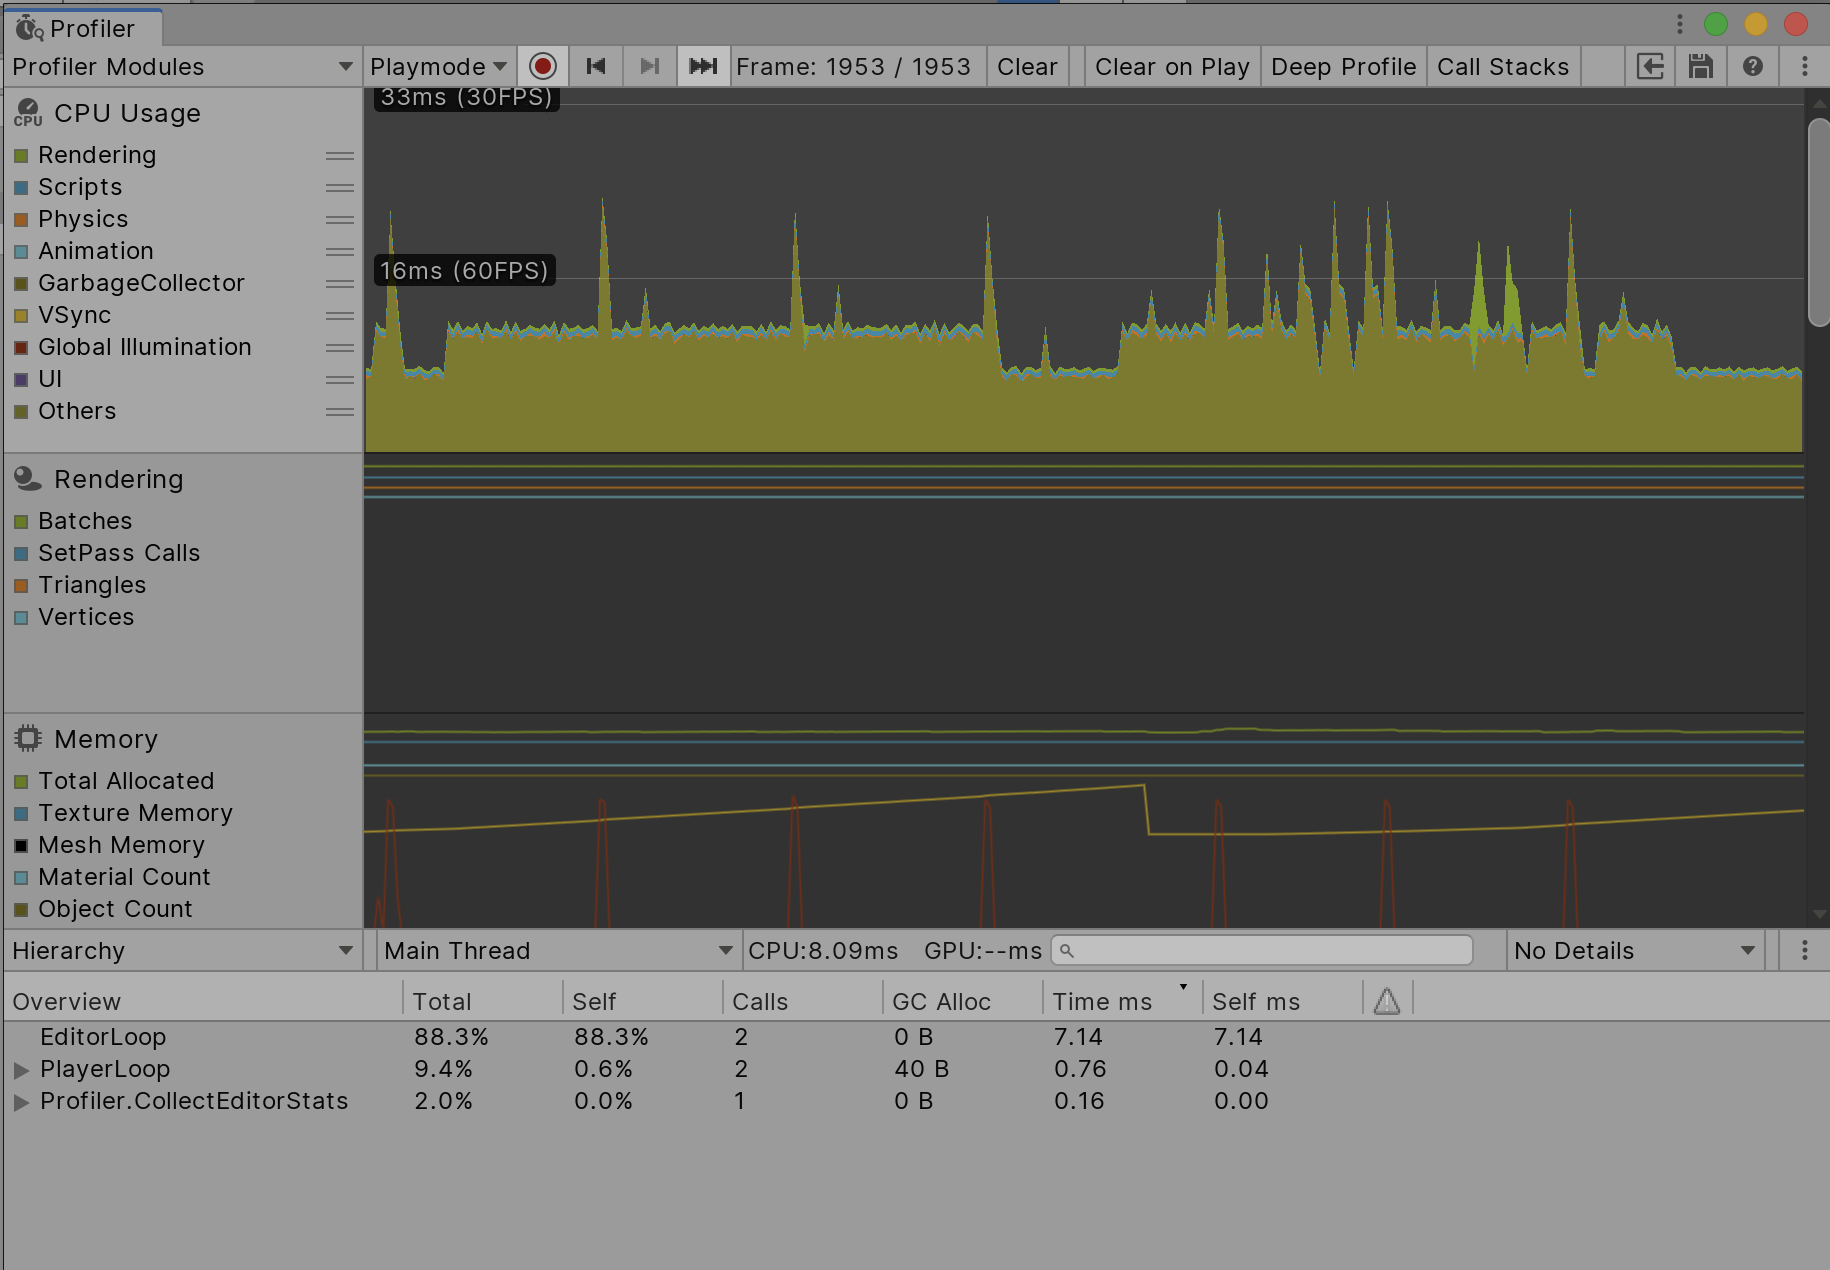
- Select a profiler on the left side. For this lesson, select CPU usage.
- The bottom half of the Profiler window will now populate with additional information (Figure 03).
The data shown here depends on the selected profiler. For example, if you have the Memory profiler selected, it will show you which assets are using the most memory and the total amount of memory being used. This is useful for determining which asset is costing the most resources and helps you pinpoint the exact cause(s) of any performance problems you may be experiencing.
Information in the Profiler window might be overwhelming at first. It’s recommended you begin with one or two profilers, depending on the problem you’re facing. For example, if your project is running slow, CPU usage would be an ideal starting point.
- To remove a profiler from the window, select the Profiler Modules dropdown and check/uncheck the profiler you wish to remove or add (Figure 04).
3. Profiler Controls
The Profiler window also has a few controls that allow you to start and stop profiling, enable and disable profiling features, and move through the data the profiler has collected.
- Record: Records the performance for further debugging and review.
- Deep Profile: When enabled, this allows the Profiler to begin profiling all of your script code. This allows you to know exactly where time is spent in your project's code. Note: Deep Profile uses a lot of memory so, as a result, your game will run significantly slower.
- Playmode: This dropdown allows you to select either profile in Playmode or in Editor.
- Clear on Play: Clears data every time you play your project.
- Clear: Clears collected information from all profilers.
- Load: Loads binary profiling information from a file. Shift-clicking will append the information to the current information in the profiler.
- Save: Saves the current profiling information to a binary file.
- Arrows: Steps forward and backward by frame in the captured data within the profiler.
A typical use of these controls would be to start profiling your project to capture a performance problem and then stop profiling once you’ve gathered the data you wanted. You can then use the timeline controls to step through the data until you reach a frame that shows the performance problem.
4. Conclusion
Becoming familiar with the Profiler will help you investigate performance problems that may crop up in your project. Not only does it provide valuable information, but gives you the ability to save recorded performance data and send it to team members to help pinpoint performance issues.