
Diagnosing Performance Problems
Tutorial
intermediate
+10XP
40m
(101)
Unity Technologies
A profiling tool gives detailed information about how a game is performing. The Profiler window is a powerful profiling tool that is built into Unity. This tutorial describes what the Profiler window is used for and how to use it to diagnose performance problems in a game or other application.
Languages available:
1. The Profiler window
Introduction
A Profiling tool gives detailed information about how our game is performing. If our game has problems, such as low framerate or high memory usage, a profiling tool can show us what is causing these problems and help us fix them.
The Profiler window is a powerful profiling tool that is built into Unity. This article is a guide to what the Profiler window is used for and how to use it. Once we have read this article and are familiar with the layout and functionality of the Profiler window, we can learn how to use the Profiler window to diagnose different types of performance problems.
The Profiler window gives us in-depth information about how different parts of our game are running.
Using the Profiler window, we can learn about different aspects of our game’s performance, such as how our game uses memory, how much CPU time is being used for different tasks, and how frequently physics calculations are being performed. Most importantly, we can use this data to help find the cause of performance problems in our game and measure the effectiveness of our attempts to fix them.
When we have a performance problem with our game, it’s essential to know the cause of the performance problem before trying to fix it. This is because different problems require different solutions. If our project is running slowly, there’s no point trying to improve graphics rendering if the real cause of the problem is overly complex physics! Equally, it’s vital to measure the effectiveness of our attempts to fix performance problems. Effective use of profiling data is the difference between optimization and just changing stuff and hoping for the best.
2. The layout of the Profiler window
Before we use the Profiler window to gather data on a game, let's open the Profiler window and familiarize ourselves with its layout.
- Open the Profiler window from the top menu bar by selecting Window > Analysis > Profiler
Note that the Profiler window only displays information when profiling data has been recorded. When we first open the Profiler window, some sections will be blank until we record profiling data from a running game.
3. Profilers
On the left of the Profiler window, you’ll see a column of profilers. Each profiler displays information about a specific aspect of our game. There are separate profilers for CPU usage, GPU usage, rendering, memory usage, audio, physics, networking, etc.
When profiling data has been recorded, the top half of the Profiler window displays data from each profiler over time. Performance can vary over time, so it’s useful to see the performance from more than one frame. Some problems may be constant, other problems may appear for only a single frame and other problems may get gradually better or worse as time passes.
The bottom half of the Profiler window displays detailed information from the currently selected profiler about the currently selected frame of data.
The type of data shown here depends on the currently selected profiler. For example, if the memory usage profiler is selected, this area will show information such as which assets are using the most memory and the total amount of memory used. If the rendering profiler is selected, this area will show statistics about the number of objects being rendered or the number of rendering operations being performed.
The profilers provide a lot of detailed information, but we don’t need to use all of them every time we profile; in fact, we would usually begin profiling our game by looking at only one or two of the profilers. As an example, if we had a game that was running slowly we might begin our investigation by looking at the CPU usage profiler.
The CPU usage profiler gives us an overview of which parts of our game are taking the most CPU time to execute. We could use that information to determine which other profilers we should look at. If, for example, we determined that physics functions were taking a long time to run, we would use the Physics profiler to gather more detailed information about the physics performance in our game.
We can hide profilers so that the display isn’t cluttered with information that we are not interested in. A profiler can be hidden by clicking the dropdown menu in the top left and selecting an already checked profiler.
A profiler can be added to the Profiler window by clicking the same dropdown in the top left of the Profiler window and selecting an unchecked profiler to add.
4. Controls
The bar at the top of the screen contains the controls for the Profiler window.
We can use these controls to start and stop profiling, to enable and disable profiling features and to move through the data that the profiler has collected.
A typical use of these controls would be to start profiling our game in time to capture a performance problem and then to stop profiling once we’d gathered the data we wanted. We would then use the timeline controls to step through the data until we reached a frame that shows a performance problem. The data for that frame would be displayed in the lower half of the screen.
5. Recording profiling data from a game using the Profiler window
Now that we understand more about the layout of the Profiler window, let’s learn how to use it to record data from our game and how to read that data to help us understand how our game is performing.
It’s important to understand that there is a small performance cost when using the Profiler window to record data. This is common to all profiling tools; it’s not possible to record and display in-depth profiling data without some overhead. While this is unlikely to make a significant difference to the way that our game runs, there may be some very minor effects on performance when the Profiler window is recording.
It is possible to profile our game in two different ways: we can profile our game while it is running inside the Unity Editor or we can profile our game while it is running outside of the Unity Editor as a development build. A development build of a Unity game differs from a regular build in two ways: a development build can connect to the Profiler window when the game is running and it includes files that enable debugging.
It is almost always best to profile a development build of our game, rather than profiling our game from within the Unity Editor. There are two reasons for this. Firstly, the data on performance and memory usage from standalone development build is much more accurate than when profiling a game in the Unity Editor. The Profiler window records data from the Unity Editor itself, which skews the results. Secondly, it is best to test our game on our target hardware whenever possible; for example, if our game is an Android game, we should test it on an Android device. Some performance problems may only appear when the game is running on certain hardware or operating systems, so we may fail to notice problems with our game if we only test it in the Unity Editor.
Having said that, there are times when it may be useful to profile our game in the Unity Editor. These are times when we are more concerned with quickly getting a broad sense of performance, rather than needing very accurate results. For example, we might want to enable and disable lots of GameObjects at runtime to find out which one is responsible for a performance problem. Testing these changes in the Unity Editor will be much quicker than making multiple builds. Once we have found roughly where the problem lies, we can then profile a development build to get the accurate information we need to fix the problem.
6. Profiling inside the Unity Editor
To record profiling data from our game while it is running inside the Unity Editor, we should follow these steps:
- Open the project that you wish to profile in Unity.
- Open the Profiler window from the top menu bar by selecting Window > Analysis > Profiler.
- In the tools section at the top of the Profiler window, ensure that Record is selected.
- Enter Play Mode.
Profiling data will now be gathered and displayed in real-time as you interact with the game.
7. Profiling a development build of our game
To record profiling data from our game on the target hardware, we need to make a development build of our game and then connect the Profiler window to that build. How we do this depends on the target platform.
8. Windows, OSX, Linux, and WebGL
To build and run a development build of our game on Windows, OSX, Linux, and WebGL, we should follow these steps:
- Open the project that you wish to profile in Unity.
- Open the Profiler window from the top menu bar by selecting Window > Analysis > Profiler.
- In the tools section at the top of the Profiler window, ensure Record is selected.
- Open the Build Settings window from the top menu (File > Build Settings).
- Ensure that the Development Build checkbox is enabled.
- Ensure that the Autoconnect Profiler checkbox is enabled.
- Click Build and Run.
The game will run on the target device. When the game is running, profiling data will be displayed in the Profiler window within the Unity Editor in real-time as you interact with the game.
9. Profiling a development build on iOS or Android
Connecting the Profiler window to a development build of a game on iOS or Android is a little more complex. This is because we need to build the game to the device and then connect the device to the Unity Editor.
Full step-by-step instructions for connecting the Profiler window to a development build of a game on iOS and Android can be found on this page of the Unity Manual.
10. Using the Profiler window to diagnose problems
Now that we understand how the Profiler window works, we can use the Profiler window to identify problems with our game and help us to fix those problems.
If your game is running slowly, stuttering or freezing, this article will show you how to use the Profiler window to find the cause of these problems.
11. Diagnosing performance problems using the Profiler window
Introduction
If our game is running slowly, stuttering or even freezing, we know that we have a performance problem. Before we can try to fix anything we need to know more about what is causing the problem. Different problems require very different solutions. If we try to guess what’s wrong or try to make changes based on what worked on other projects, we could waste time or even make our problems worse.
This is where profiling comes in. Profiling is the process of measuring aspects of our game’s performance at runtime. By using a profiling tool, we can see what’s going on behind the scenes when our game is running and use this information to track down the cause of our performance problem. By watching the profiling tool as we make changes, we can measure the results of the changes we make so we can tell whether our efforts to fix the problem are effective.
In this article, we will:
- Use Unity’s built-in Profiler window to gather data on our poorly-performing game
- Analyze this data and use the results of this analysis to track down the cause of the performance problems
- Find links to articles on fixing these specific problems
Getting a game to run quickly and smoothly is a balancing act. It may take several rounds of making changes and measuring the effects of those changes before we get the results we want. Knowing how to use profiling tools to analyze our problems means that we will be able to identify what’s wrong and understand what we should try next.
12. Before we begin
This article will help us to track down problems with Unity games that are running slowly, stuttering or freezing in places. If our game has other problems - for example, if our game is crashing or if the graphics do not look like we expect them to look - then this article probably won’t help with our problem. If we’re having problems with our game that aren’t covered by this article, we can try searching the Unity Manual, Unity Forums or Unity Answers.
13. A brief introduction to performance in games
Frame rate is a standard measure of performance in games. In games, a frame is like a frame in animation; it’s a still image of our game that is drawn to the screen. Drawing a frame to the screen is known as rendering a frame. Frame rate, or how fast the frames are being rendered, is measured in frames per second (FPS).
Most modern games aim to achieve a frame rate of 60 FPS. Generally, a frame rate of above 30 FPS is considered acceptable, especially for games that do not require quick reactions such as puzzle games or adventure games. Some projects have special requirements; in VR, for example, 90 FPS is considered critical. At frame rates below 30 FPS, players generally find the experience unpleasant; graphics may seem jerky and controls can feel unresponsive. However, it’s not just speed that is important; the frame rate must also be consistent. Changes in frame rate are very noticeable to players and an inconsistent frame rate is generally considered to be worse than a low but steady frame rate.
Although frame rate is a common way to talk about a game’s performance, when we are trying to improve our game’s performance it is more useful for us to think of how long it takes to render a frame in milliseconds. This is for two reasons. Firstly, this is a more precise measure. When we are trying to improve our game’s performance, every millisecond can count towards our goal. Secondly, relative changes in frame rate mean very different things at different scales. A change from 60 to 50 FPS represents an additional 3.3 ms of processing time, but a change from 30 to 20 FPS represents an additional 16.6 ms of processing time. Both of these examples are of a 10 FPS drop, but the difference in the time taken to render the frame is significant.
It’s useful for us to understand how many milliseconds a frame must be rendered in to meet common frame rates. To find this figure, we should follow the formula 1000/[desired frame rate]. Using this formula, we can see that for a game to render 30 frames per second, it must render each frame within 33.3 milliseconds. For a game to run at 60 FPS, it must render each frame within 16.6 milliseconds.
For every frame that is rendered, Unity must perform lots of different tasks. In simple terms, Unity must update the state of the game, take a snapshot of the game and then draw that snapshot to the screen. Tasks that must occur during each frame include things like reading user input, executing scripts and performing lighting calculations. In addition to this, there are operations that can happen many times during a single frame, such as physics calculations. When all of these tasks are being performed quickly enough, our game will have a consistent and acceptable frame rate. When all of these tasks cannot be performed quickly enough, frames will take too long to render and the frame rate will drop.
Knowing which tasks are taking too long to perform is critical to know how to solve our performance issues. Once we know which tasks are reducing our frame rate, we can try to optimize that part of our game. This is why profiling is so critical: profiling tools show us how long each task takes in any given frame.
14. Recording profiling data
In order to investigate our performance problem, we must first record profiling data from a part of our game that is performing poorly. To get accurate profiling data, we will make a development build of our game and record profiling data while the game is running on its target hardware.
15. Record data from a development build of our game
1. Create a development build of the game on our target device.
2. Begin recording profiling data just before we reach a part of our game that has performance problems.
3. Once we have recorded profiling data that includes an example of a performance problem, click anywhere in the top of the Profiler window to pause the game and select a frame.
4. In the top part of the Profiler window, select a frame that demonstrates poor performance. This may be a "spike" or just a typical frame where the frame rate is below our desired value. We can use the left and right arrow keys or the back and forward icon buttons in the Profiler window to move between frames for finer control.
We have gathered profiling data from a poorly performing part of our game. Next, let’s learn how to analyze this data.
16. Analyzing profiling data
Before we can draw any conclusions about the cause of our performance problems, we must learn how to read and analyze the performance data that is displayed in the Profiler window. As we know, frame rate drops occur when Unity is unable to complete all of the tasks required to render a frame in a timely manner. We will use the Profiler window to see what tasks are being performed, how long the tasks take and what order the tasks are performed in. This information will help us to understand what parts of our game are causing our frames to take too long to render.
It’s best to learn how to profile rather than trying to learn an exact sequence of steps. It’s far more useful to be able to interpret the data ourselves so that when we encounter a new problem we can investigate it ourselves. Even if we only learn what to search for on Unity Answers, that’s a great start!
To learn how to profile, we will use the CPU usage profiler as an example. This is likely to be the profiler that we will use the most when investigating frame rate issues.
17. The CPU usage profiler
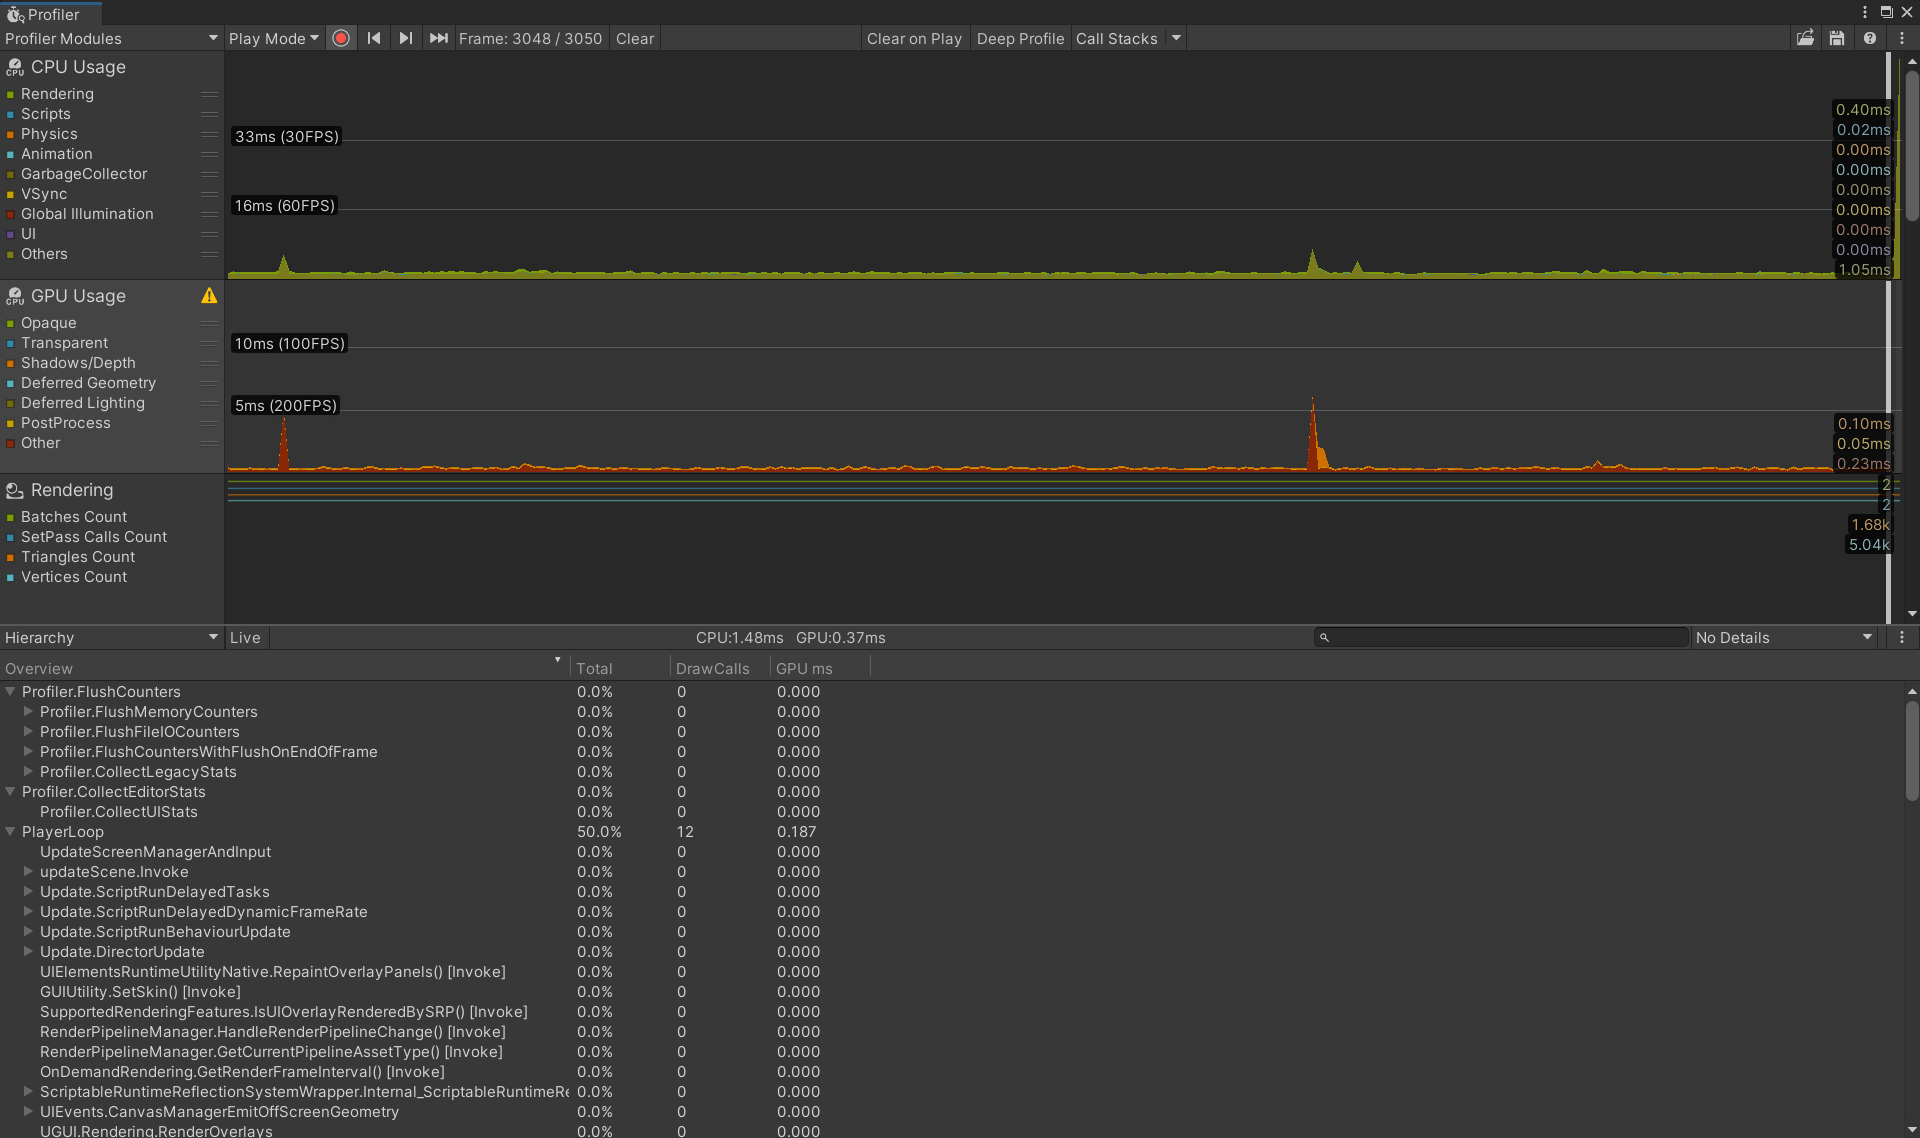
When we look at the CPU usage profiler in the top part of the Profiler window, we can see the time it takes the CPU to complete its tasks during each frame.
We can see a color-coded breakdown of how that time is spent. Different colors represent time spent on rendering operations, physics calculations, and so on. The key in the profiler indicates which colors represent which tasks.
In the following screenshot, we can see that the majority of the time for this frame is spent on rendering operations. The CPU time indicator at the bottom of the following image indicates that our total CPU time for this frame is 114.17 ms.
18. The Hierarchy view
Let’s use the CPU usage profiler’s Hierarchy view to dig deeper into this information and see exactly which tasks are taking the most CPU time during this frame. With the CPU usage profiler selected, we can view detailed information about the frame in the lower half of the Profiler window. Looking at the lower half of the Profiler window, we can use the drop-down menu in the top left to select the Hierarchy view. This allows us to see detailed information on the CPU tasks that are happening.
Within the Hierarchy view, clicking on any column header sorts the information by the value of that column; for example, clicking Time ms sorts the functions by the ones that take the longest, and clicking Calls sorts the functions by the number of times they are called during the currently highlighted frame. In the above screenshot, we have sorted the functions by time and we can see that the task that is taking the most CPU time other than the Editor Loop is the function Camera.Render.
If a function has an arrow to the left of its name we can expand it to see which other functions are called by that function, and how they affect performance. The column Self ms indicates how much time is taken by the function itself, and Time ms indicates how much time is taken by this function and all the other functions that are called by it.
In this case, we can see that within Camera.Render, the most costly functions are related to a function called Shadows.RenderJob. Even if we don’t know much about this specific function yet, we already have a lot of information about our problem. We know that our problems are related to rendering and that the most expensive tasks happening at this point have to do with shadows.
Another useful thing we can do in the Hierarchy view is to compare frames within our game so that we can get an understanding of how performance changes over time. We can track the cost of an individual function from frame to frame using the CPU usage profiler. When we click on a function name in the Hierarchy view, the CPU usage profiler will highlight that function’s contribution in the graph at the top of the Profiler window.
For example, if we click on Drawing in the Hierarchy view, the part of the Rendering data that is directly associated with Drawing will be highlighted in the graph.
19. The Timeline view
Now let’s use the CPU usage profiler’s Timeline view to learn more about our rendering problem. The Timeline view shows us two things: the order in which CPU tasks are performed, and which thread is responsible for which tasks. We can select the Timeline view using the drop-down menu in the top left corner of the bottom half of the Profiler window (where it previously read Hierarchy).
Threads allow separate tasks to happen simultaneously; while one thread performs one task, another thread can perform a completely separate task. There are three types of thread involved in Unity’s rendering process: the main thread, the render thread, and worker threads. Knowing which thread is responsible for which task is very useful: once we know which thread the slowest tasks take place on, we know that we should focus our efforts on optimizing operations that take those threads.
We can zoom in on the Timeline view to get a closer look at individual tasks. Functions that are called by other functions are shown immediately below them. In this example, we have zoomed in on Shadows.RenderJob to see the individual tasks that make up this task. We can see that Shadows.RenderJob calls functions that take place on the main thread. We can also see worker threads performing tasks related to shadows. The presence of a task called WaitingForJob on the main thread indicates that the main thread is waiting for a worker thread to complete a task. From this, we can conclude that rendering operations relating to shadows are taking too long on the main thread and on worker threads. We now know a lot about our problem!
20. Other profilers
Although the CPU usage profiler is the most commonly used profiler when tracking down performance problems related to frame rate, the other profilers can be very useful too. It’s a good idea to get familiar with the information they provide.
Try to follow the steps above for a few different profilers, trying out the different views and learning what information they give on each frame. For example, try using the Rendering profiler to see how rendering statistics change from frame to frame.
21. Determining the cause of performance problems
Now that we are familiar with the process of reading and analyzing performance data in the Profiler window, we can begin to find the cause of our performance problem.
22. Rule out VSync
Vertical Synchronization, known as VSync, is used to match a game’s frame rate to the refresh rate of the screen it is being displayed on. VSync can affect the frame rate of our game and its effects can show in the Profiler window. If we are not sure what we’re looking at, it can look like a performance problem, so before we go any further we need to learn how to rule VSync out of our investigations.
23. Hiding VSync information in the CPU usage profiler
We can choose to hide information in the CPU usage profiler graph. This allows us to ignore information that is not useful to our current investigations.
To hide VSync information from the CPU usage profiler graph, follow these steps:
- Click on the CPU usage profiler to select it.
- In the top part of the Profiler window, where the CPU usage profiler shows its data over time, click the yellow-colored square labeled VSync to hide VSync information from the graph.
24. Disregarding VSync information in the Hierarchy view
There is no way of hiding VSync information from the CPU usage profiler’s Hierarchy view, but we can learn what it looks like so that we can disregard it.
Whenever we see a function called WaitForTargetFPS in the Hierarchy view, this means that our game is waiting for VSync. We do not need to investigate this function and can safely ignore it.
25. Disabling VSync
VSync cannot be disabled on all platforms: many (such as iOS) enforce its use. However, if we are developing for a platform that does not enforce VSync we can disable it altogether in our project while we profile. To disable VSync, open the Quality Settings inspector by going to the top menu bar and selecting Edit > Project Settings, then select Quality in the Project Settings window. From the drop-down menu labeled VSync Count, select Don’t Sync.
26. Rendering profiling
Rendering is a common cause of performance problems. It’s important to identify whether our game is CPU bound or GPU bound before attempting to fix a rendering problem, as these situations require different approaches.
Put very simply, the central processing unit (CPU) is responsible for determining what must be drawn and the graphics processing unit (GPU) is responsible for drawing it. When a rendering performance problem is due to the CPU taking too long to render a frame, our game is what is known as CPU bound. When a rendering performance problem is due to the GPU taking too long to render a frame, our game is what is known as GPU bound.
27. Identifying if our game is GPU bound
The quickest way to identify if our game is GPU bound is by using Unity’s GPU usage profiler. Unfortunately, not all devices and drivers support this profiler. Before we can check if our game is GPU bound, we first need to check whether the GPU usage profiler is available for our target device.
To check if the GPU usage profiler is available on our target device, we should carry out the following steps:
- In the top left corner of the Profiler window, select Add profiler.
- Choose GPU from the drop-down menu.
If the GPU usage profiler is not supported by our target device, we will see a message that begins "GPU Profiling is not enabled" where the GPU usage profiler would normally display its data.
If we do not see this message, this means that the GPU usage profiler is supported by our target device. If this is the case and the GPU Usage profiler is available, it’s quick and easy to see if our game is GPU bound by carrying out the following steps:
- Click on the GPU usage profiler to select it
- Look at the area in the center of the screen where the CPU and GPU times for the currently selected frame are displayed.
If the GPU time is in excess of the CPU time, we have identified that our game is GPU bound at this point.
If the GPU usage profiler is not available for our target hardware, we can still identify if our game is GPU bound. We do this by observing the CPU usage. If we can see that the CPU is waiting for the GPU to complete its tasks, this means that our game is GPU bound. To find out if this is the case, we can carry out the following steps:
- Click on the CPU usage profiler to select it.
- Examine the area at the bottom of the Profiler window that shows detailed information about the currently selected frame and profiler.
- Select Hierarchy from the drop-down menu in the top left of this area.
- Select the Time ms column to sort the functions by time in milliseconds.
If the function Gfx.WaitForPresent is taking the longest in the CPU Usage profiler, this indicates that the CPU is waiting for the GPU. This means that our game is GPU bound at this point.
If we have identified that our game is GPU bound, we should read the tutorial on Fixing Performance Problems: Optimizing graphics rendering in Unity games.
28. Identifying if our game is CPU bound
If we haven’t yet identified the cause of our performance problem, let’s now investigate CPU based rendering issues.
- Click on the CPU usage profiler to select it.
- In the top part of the Profiler window, where the CPU usage profiler shows its data over time, examine the colored portion of the graph that represents rendering. We can hide or show data in the graph by clicking the colored square next to its name in the key.
If a large part of the frame time on a slow frame is taken up by rendering, this indicates that rendering could be the cause of our problem. We can dig into the profiling data to confirm this by following these steps:
- Click on the CPU usage profiler to select it.
- Examine the area at the bottom of the Profiler window that shows detailed information about the currently selected frame and profiler.
- Select Hierarchy from the drop-down menu in the top left of this area.
- Select the Time ms column to sort the functions by time in milliseconds.
- Click on the function at the top of the list to select it.
If the selected function is a rendering function, the CPU profiler graph will highlight it as part of the Rendering display. If this is the case, this means that rendering-related operations are causing our game to perform poorly and our game is CPU bound at this point. Note the function name and which thread is performing the function; this information will be useful when trying to fix the problem.
If we have identified that our game is CPU bound due to rendering issues, we should read the Graphics performance and profiling documentation.
29. Garbage Collection profiling
Next, we’ll check to see if garbage collection is causing the bottleneck. Garbage collection is a feature related to Unity’s automatic memory management, and it can be a slow operation.
- Click on the CPU usage profiler to select it.
- In the top part of the Profiler window, where the CPU usage profiler shows its data over time, examine the part of the graph that represents the Garbage Collector. We can hide or show data in the graph by clicking the colored square next to its name in the key. Note that you can also drag the name of the particular aspect you’re interested in, to reorder them. In the following screenshot, we have dragged GarbageCollector to the top of the list, and clicked the colored boxes of all other aspects, in order to switch them off.
If a large part of the frame time on a slow frame is taken up by garbage collection, this could indicate that we have a problem with excessive garbage collection. We can dig into the profiling data to confirm this.
- With the CPU usage profiler selected, examine the area at the bottom of the Profiler window that shows detailed information about the currently selected frame.
- Select Hierarchy from the drop-down menu in the top left of this area.
- Select the Time ms column to sort the functions by time in milliseconds.
If the function GC.Collect() appears and is taking up excessive CPU time, then we have identified a garbage collection problem with our game.
30. Solving garbage collection problems
If we have identified a garbage collection problem with our game, we should read the documentation on Garbage collection best practices.
31. Physics profiling
If we have ruled out rendering and garbage collection, let’s check to see whether complex physics calculations are the cause of our performance problem.
- Click on the CPU Usage profiler to select it.
- In the top part of the Profiler window, where the CPU Usage profiler shows data over time, examine the part of the graph that represents Physics (orange-colored graphs). We can hide or show data in the graph by clicking the colored square next to its name.
If a large part of the frame time on a slow frame is taken up by physics, that indicates that physics could be the cause of our problem. We can dig into the profiling data to confirm this.
- With the CPU usage profiler selected, examine the area at the bottom of the Profiler window that shows detailed information about the currently selected frame.
- Select Hierarchy from the drop-down menu in the top left of this area.
- Select the Time ms column to sort the functions by time in milliseconds.
- Click on the functions at the top of the list to select them.
If they are physics functions, the CPU profiler graph will highlight them as part of the Physics display. If this is the case, we have identified that our current performance problem relates to physics.
32. Solving physics problems
If we have identified that our performance problem is due to physics, there are a few resources that will be helpful:
- This page of the Unity Manual, although written with iOS developers in mind, has some physics optimization tips that are applicable to all Unity games.
- This tutorial on optimizing physics in a Unity game contains a number of helpful tips.
- The physics section of this Unite 2012 talk on optimization contains a useful summary of common physics problems.
33. Slow scripts
Now let’s check whether slow or overly complex scripts are the cause of our performance problem. Scripts, in this context, means code that is not part of the Unity Engine. This usually means scripts that we have written ourselves, but it may include, for example, code that is part of a plugin we are using in our project.
- Click on the CPU usage profiler to select it.
- In the top part of the Profiler window, where the CPU usage profiler shows data over time, examine the part of the graph that represents Scripts. We can hide or show data in the graph by clicking the colored square next to its name.
If a large part of the frame time on a slow frame is taken up by scripts, that indicates that slow user scripts could be the cause of our problem. We can dig into the profiling data to confirm this.
- With the CPU usage profiler selected, examine the area at the bottom of the Profiler window that shows detailed information about the currently selected frame.
- Select Hierarchy from the drop-down menu in the top left of this area.
- Select the Time ms column to sort the functions by time in milliseconds.
- Click on the functions at the top of the list to select them.
If they are user script functions, the CPU profiler graph will highlight them as part of the Scripts display. If this is the case, we have identified that our current performance problem relates to scripts.
Please note that there is an exception to the above: if our game contains code that relates to renderings, such as code within OnWillRenderObject or OnPreCull functions, this will show in the top part of the Profiler window when the CPU usage profiler as Rendering data rather than Script data.
Although this may be a little confusing at first, examining the functions in the Hierarchy and Timeline view, as usual, will allow us to track down the code responsible.
34. Solving slow script problems
If we have established that our user scripts are causing performance problems, there are a few simple techniques that are likely to improve performance. Here are a few recommended sources of information on user script optimization:
- If you want to learn more about optimization in Unity, start with the guidance provided in the Unity Manual.
- This Unite 2012 talk on optimization contains a useful summary of common scripting problems.
35. Other causes of performance problems
Although we have covered four of the most common causes of performance problems, our game may have a performance problem that is not related to these areas. If this is the case, we should follow the same approach as for the problems above: gather data, investigate with the CPU usage profiler and find out the name of the function that is causing the problem. Once we know the name of the function, we can search the Unity Manual, Unity Forums or Unity Answers for information on this function and how we might be able to reduce its cost.