
Profiling Tools
Tutorial
intermediate
+0XP
30 mins
(232)
Unity Technologies
In this tutorial, we identify the optimization tools that allow you to measure performance and identify bottlenecks in your 3D mobile application.
Languages available:
1. Profiling in Unity
To test how your game performs on a mobile device, you can use several tools, such as profilers and graphics debuggers. These tools give you a detailed view of exactly how the resources of a given device, such as your development machine or mobile phone, were used by your game.
Unity's built-in Profiler (Window > Analysis > Profiler) analyzes scenes in your game as it runs in the Unity Editor or a connected device to show you where your application is spending its time. The profiler displays the data in charts to visualize how the device handles CPU and GPU workloads. From here, you can identify problem areas in your game and discover opportunities to optimize performance.
Unity's built-in Frame Debugger (Window > Analysis > Frame Debugger) helps you explore the OpenGL ES or Vulkan API calls your game makes, down to every draw call, so you can identify rendering defects, assess level of detail in your scene, and find expensive shaders to optimize.
Below is a screenshot of the Profiler’s graphed measurements while an application is running, visualizing CPU usage, memory footprint, and specific operations on each CPU thread:
2. Profiling in the Unity Editor vs. Device
It’s convenient to profile your application using the built-in Profiler on your development machine if you run into immediate problems during production. To truly grasp the performance of and potential bottlenecks in your mobile application, we strongly recommend that you build your app to your target devices and profile there.
Profiling on your development machine is useful and quick, but the process carries the overhead of rendering your mobile application in the Unity Editor along with the overhead of the Editor itself. When building to your target mobile device, you isolate your entire application while gaining the benefits of the built-in Profiler, thus profiling and testing in a much more accurate situation.
More information about creating Development Builds for the platform of your choice can be found in the Unity Documentation.
3. Profiling with Arm Streamline
While the Unity Profiler shows you when certain jobs are scheduled at runtime, it doesn’t show available CPU or GPU resources or how those resources are being used on the mobile device you’re profiling on.
Arm Streamline is a performance profiler that is available as part of Arm Mobile Studio, a free-to-use suite of performance analysis tools for debugging and optimizing Android applications on devices that use an Arm Mali GPU. Streamline analyzes your game as it runs on an unrooted device and presents performance counter data to help you understand how your mobile application uses the device’s resources.
Streamline measures CPU activity to find areas where you can reduce usage and analyzes active GPU workloads in your mobile application’s problem areas. You can explore how the GPU handles triangles that were too small to be rendered, off-screen, or overdrawn. Streamline can also help you assess shader performance and texture usage.
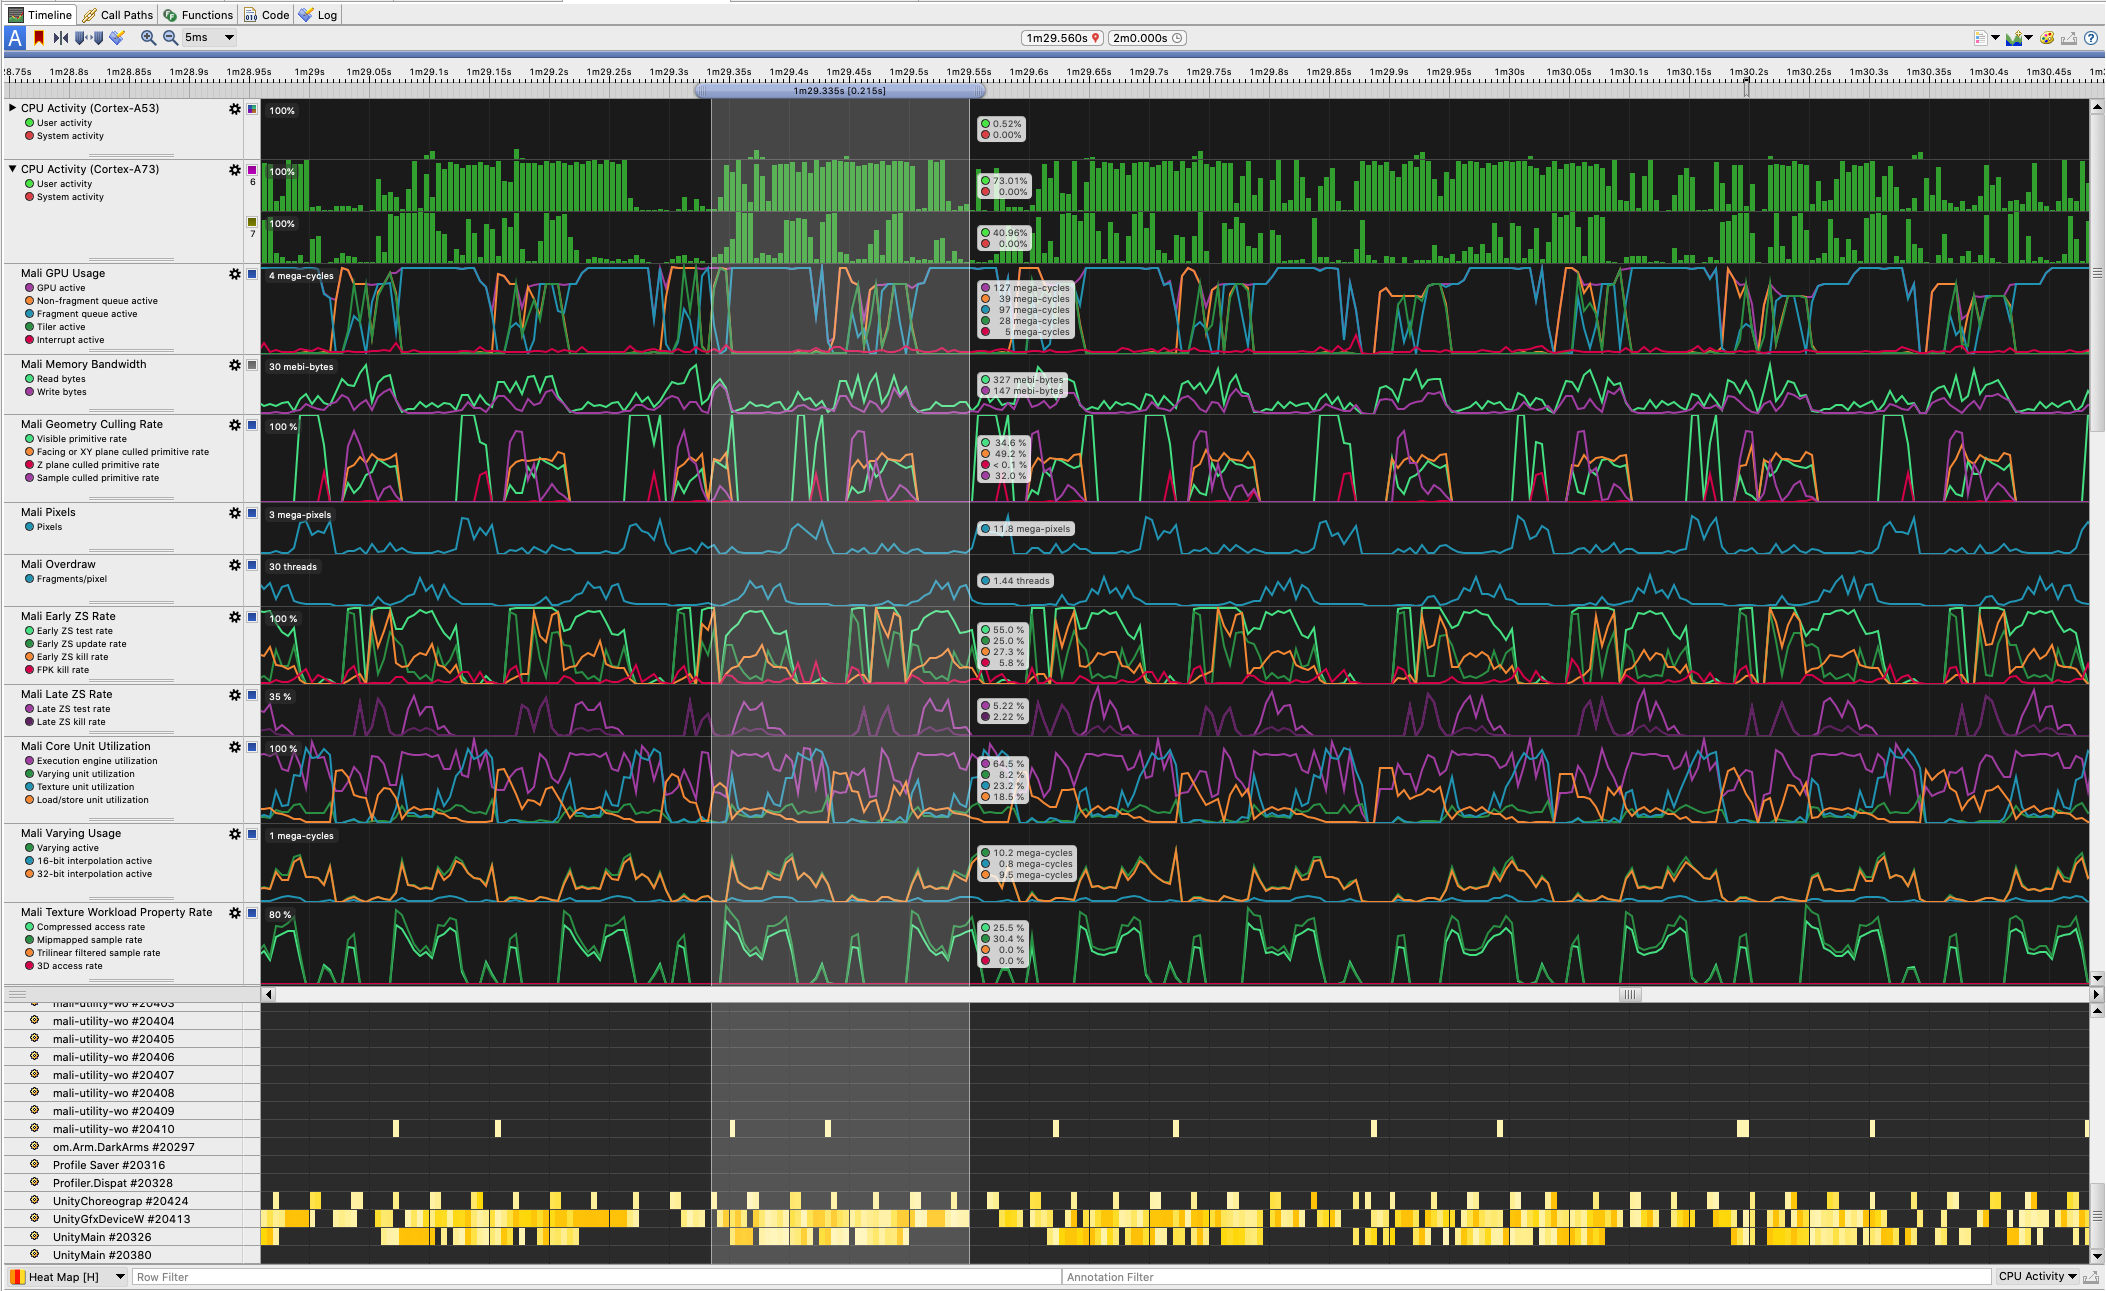
The following screenshot shows Streamline's timeline view, displaying detailed measurements of an Android device’s resources, such as CPU and bus activity:
You can learn more about how to profile your mobile applications with Arm Streamline here.
4. Conclusion
The profiling and optimization workflow is a useful iterative process for finding potential bottlenecks while collecting and analyzing performance data for your mobile app. Unity's built-in Profiler and Frame Debugger are great starting points for analyzing how resources are used by your application. When a finer measurement is needed, tools such as Arm Streamline are a great solution for profiling on your target mobile device.
In the next project, we begin our journey into art optimization by learning about how we can create the geometry for our 3D mobile application with performance in mind.