Using the Physics Debugger
Tutorial
Beginner
+10XP
10 mins
(127)
Unity Technologies

In this tutorial, you will learn how to use the Physics Debugger.
Languages available:
1. Using the Physics Debugger
Verified: 2019.4
Like other debug and analysis tools within Unity, the Physics Debugger can help you visualize the various physics entities that comprise your Scene. It’s good to become acquainted with the Physics Debugger in order to diagnose potential errors or oddities.
1. To open the debugger, navigate to Window > Analysis > Physics Debugger (Figure 01).
From this menu, you choose which physics entities you want visible categorized by type (e.g., Sphere vs. Box Colliders), function (e.g., Triggers vs. Colliders, and Layers.
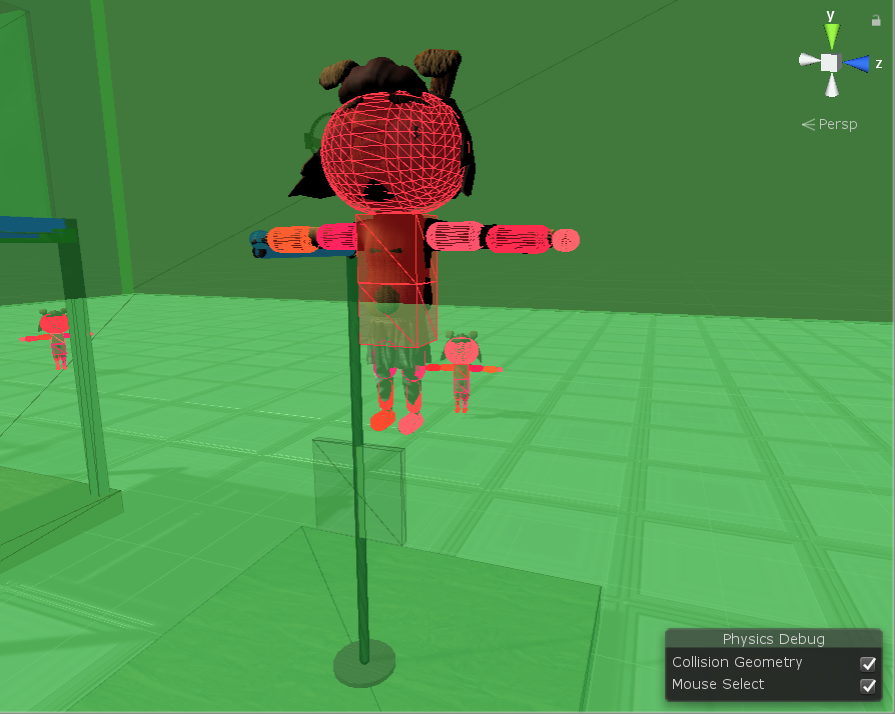
Changes made in this menu are reflected in the Scene view. A secondary Physics Debug menu in the lower right corner of the Scene view provides additional options (Figure 02):
Mouse Select highlights and allows you to toggle whether the physics entities can be selected in the Hierarchy from this view.
Collision Geometry toggles whether the visualizations defined in the Physics Debugger are visible or not.
2. Conclusion
There can be numerous reasons for physics issues in your Scene. The Physics Debugger should be your starting point for diagnosing where these issues stem from.