
Week 4: Dec. 6 - 10, 2021
Tutorial
Beginner
+0XP
180 mins
(17)
Unity Technologies
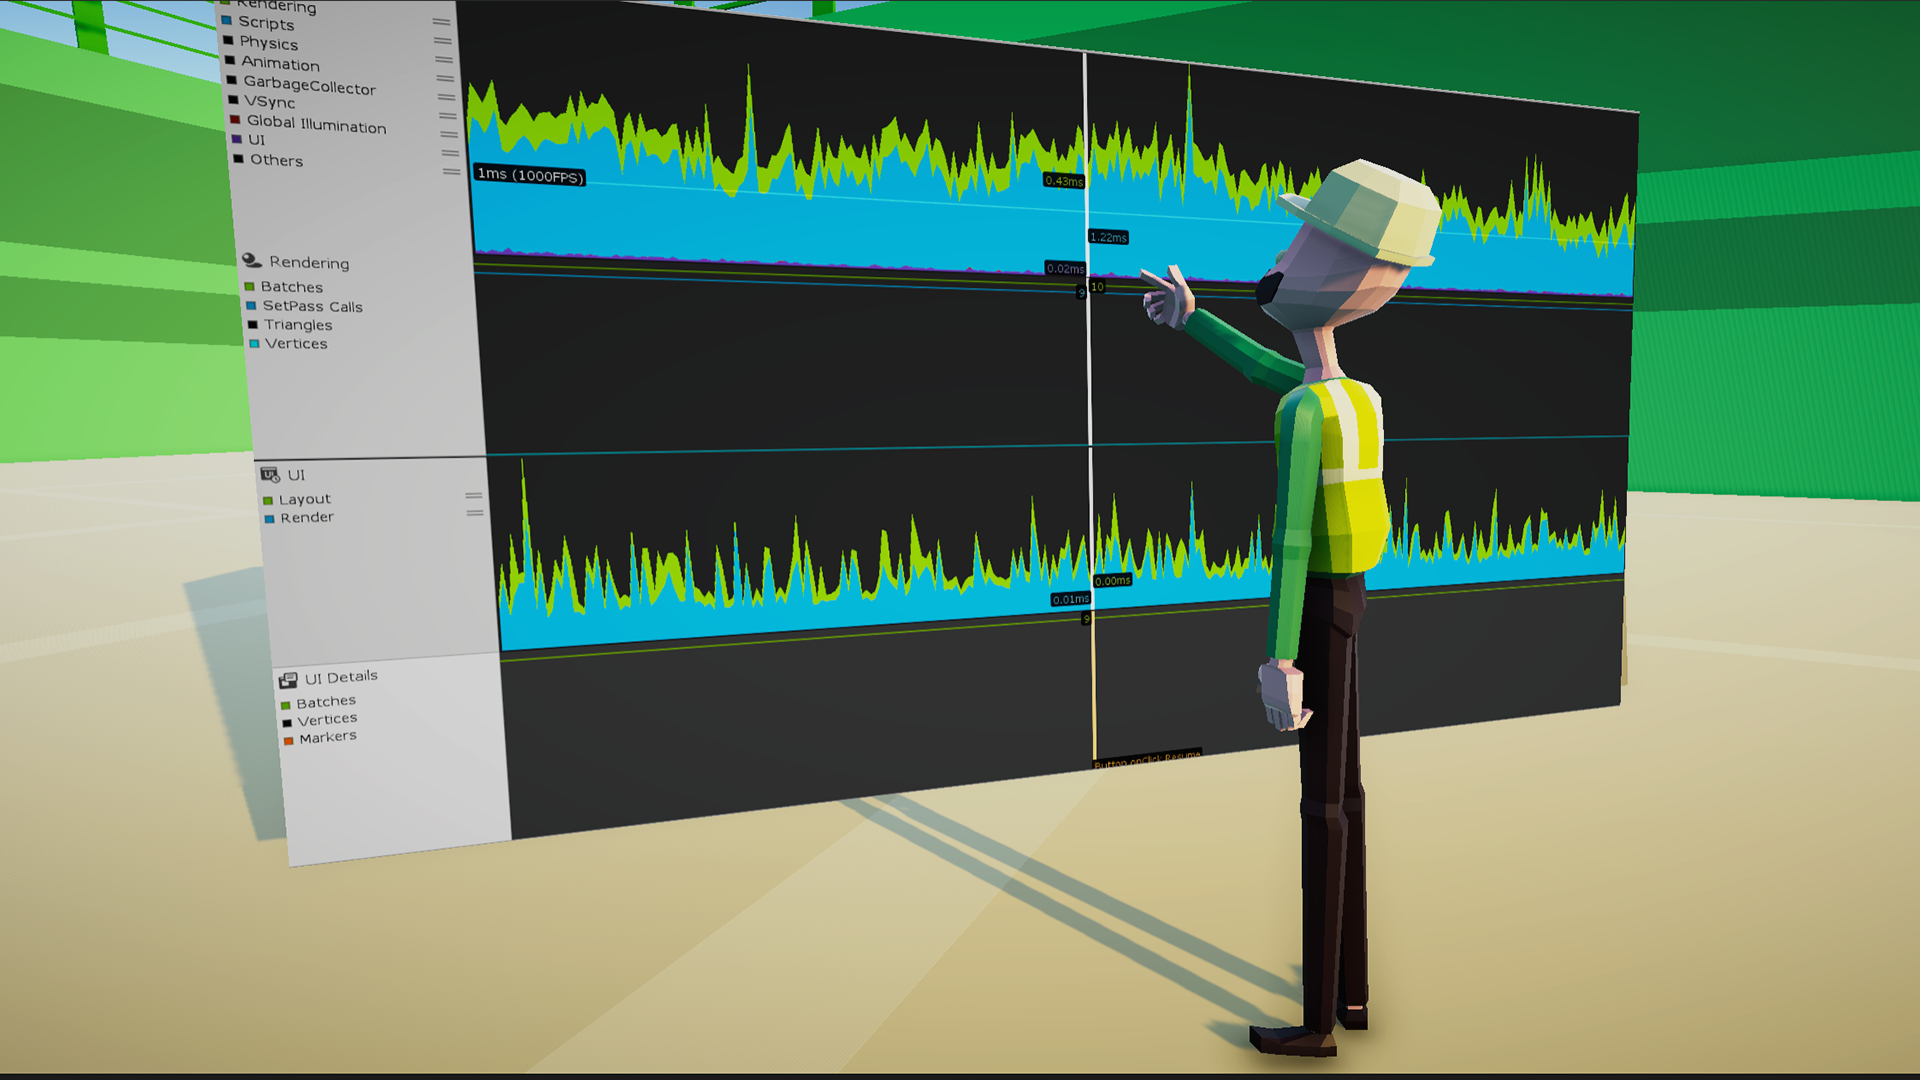
In this tutorial, you’ll learn how to use the Profiler to analyze a scene and identify where optimization bottlenecks are occurring.
By the end of this tutorial, you will be able to:
- Deduce the script method that uses the most CPU time (vs. a script method that does not) by using the CPU profiler in the Profiler window
- Differentiate a loop that efficiently goes through a collection once in an Update() call from many loops that go through the same collection in an Update() call
- Recognize possible issues that might cause performance problems (e.g., too many RigidBody components, too many Colliders, too many shadows, etc.), given a scenario
- Investigate performance issues caused by poly count, texture sizes, or too many objects on the screen by using Unity's Stats window
- Identify unnecessary nested if statements
Review guidance on:
- Evidencing your progress
- Updating your portfolio and resume
- Preparing for interviews
Languages available:
1. Jr. Programmer Mission 4 - Part 2
This week you'll wrap up Jr. Programmer by going through the the following tutorials
2. Monday Dec 6, 2021 Live Session
Recorded live on Monday, Dec 6, 2021.
3. Thursday December 9, 2021 Live Session
Recorded Session from: Thursday, Dec 9, 2021.
4. Week 4 Power Up Session
Recorded Live Session: Friday, Dec 10, 2021.