
Working with the Frame Debugger - 2019.3
Tutorial
intermediate
+10XP
15m
(71)
Unity Technologies
In this tutorial, you will learn how to use the Frame Debugger.
Languages available:
1. Introduction
If you are using Unity 2019.2 or lower, click here.
The Frame Debugger is a handy tool that allows you to freeze playback for a running game on a particular frame to view the individual draw calls used to render that frame. The debugger also lets you go through frames one-by-one so you can see in greater detail how the Scene is constructed. This will help you debug your projects when you’re particular Scenes are causing frame rate issues.
2. Using the Frame Debugger
Let’s open the Frame Debug Window and see what it can do. First, make sure you have a project open and a Scene with objects loaded so you can see the draw calls within the window.
1. Open the Frame Debug by clicking Window > Analysis > Frame Debugger.
2. In the new window, click the Enable button on the top-left toolbar (Figure 01).
3. Click any of the Draw Mesh calls on the left side of the window. When you click a Draw Mesh, it will update the Game window with what the Draw Mesh has actually rendered (Figure 02).
The Frame Debug window is segmented into sections so you can more easily find the information you’re looking for. On the left side is the sequence of draw calls and other events such as Post Processing effects. The right side of the window gives further information about the selected draw call, such as the geometry detail and the shader used for the rendering (Figure 03).
3. How to get the most out of the Frame Debugger
The Frame Debug window has plenty of buttons and tools to help your sift through the information (Figure 04).
- Enable/Disable: Toggles to Enable and Disable Frame Debugger
- Editor Dropdown: This allows you to preview either the selected draw calls from the Editor camera or from a remote editor by IP. Note: The given player has to support multithreaded rendering and Development Build must be checked. Additionally, make sure Run in Background is checked.
- Slider: Allows you to scrub through all the draw calls.
- Arrows: Allows you to move forward or backward through the draw calls.
Additionally, you can isolate the renders by channels and brightness.
- Render Target: Allows you to change the render target if you have multiple renders at once.
- Channels: Lets you isolate the red, green, blue, and alpha channels for the current state of the Game view. When you isolate the alpha channel, you will be able to see the occlusion (RT0) and smoothness (RT1) of the deferred g-buffer.
- Levels: Allows you to isolate areas of the view according to brightness levels.
Note: The Levels and Channels options are only available when rendering into a RenderTexture.
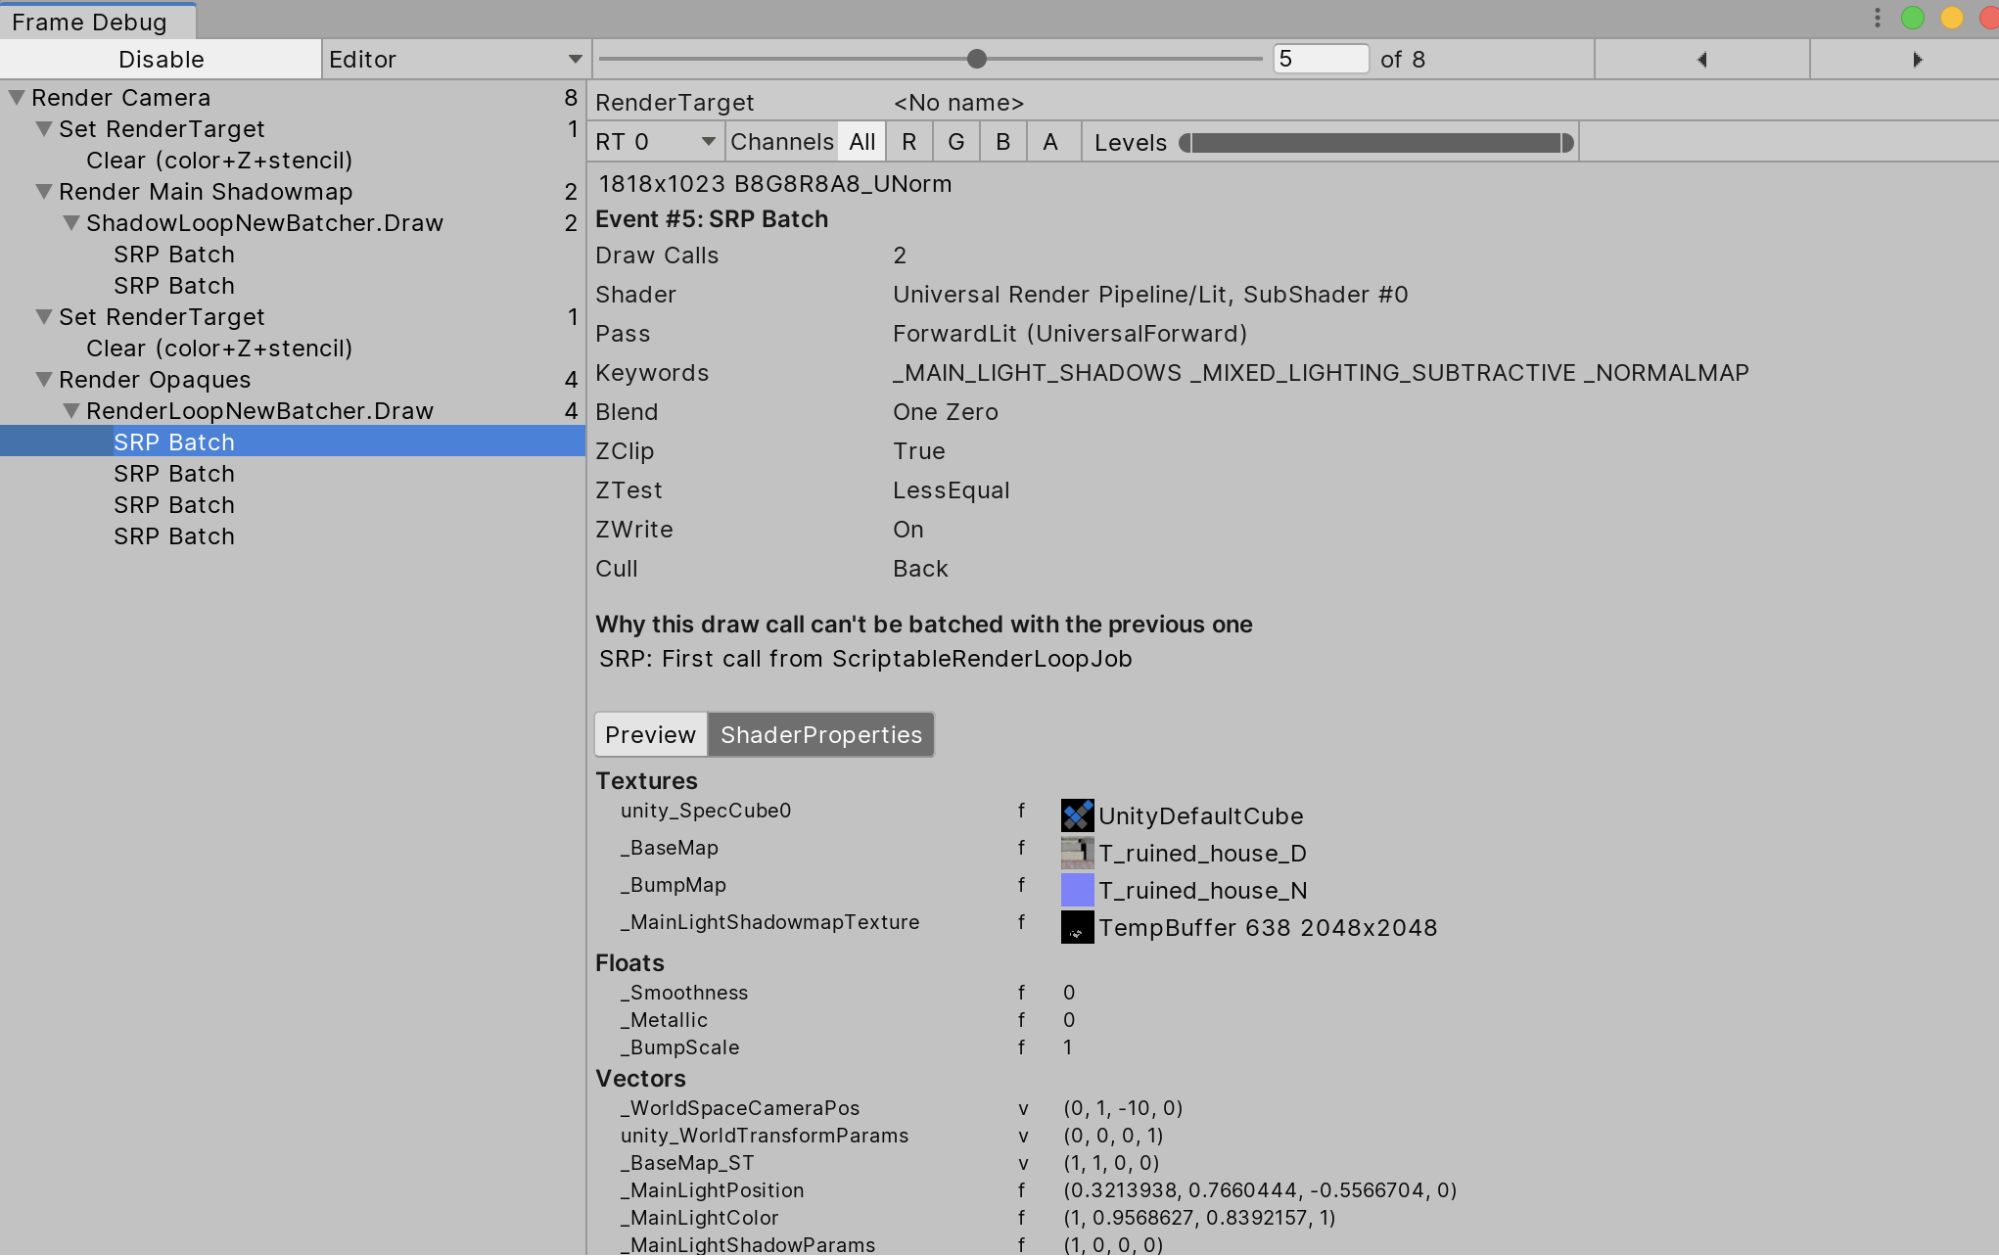
4. Viewing Shader Properties
When you select a draw call, you can view the Shader’s property values.
1. Select a draw call on the left side of the window.
2. Select the ShaderProperties button (Figure 06).
ShaderProperties will also display which shader stages were used. It’s useful to know the current state of the selected shader and the properties it’s using — it’s helpful to make sure your Shaders are working properly during the draw process.
5. Conclusion
The Frame Debug window is a useful tool that gives you in-depth information about a particular frame. It’ll help you debug Scenes for issues tied to lighting, rendering, or frame rate.