
Working with the Stats Window
Tutorial
intermediate
+10XP
15m
(127)
Unity Technologies
Inside the Game window, there’s a Stats button in the top right corner. When this button is pressed, an overlay window appears. This window shows real-time rendering statistics, which is incredibly useful for optimizing performance. In this tutorial, you will learn about the Stats window and its uses.
Languages available:
1. The Stats Window
Verified: Unity 2019.4
Verified in 2019.3 - https://learn.unity.com/tutorial/working-with-the-stats-window-2019-3
Inside the Game window, there’s a Stats button in the top right corner. When this button is pressed, an overlay window appears. This window shows real-time rendering statistics, which is incredibly useful for optimizing performance. The statistics displayed in the overlay window will vary depending on the build target you’ve defined.
To open the Statistics overlay:
1. Go to your Game view window.
2. In the top right corner of the window, click Stats (Figure 01).
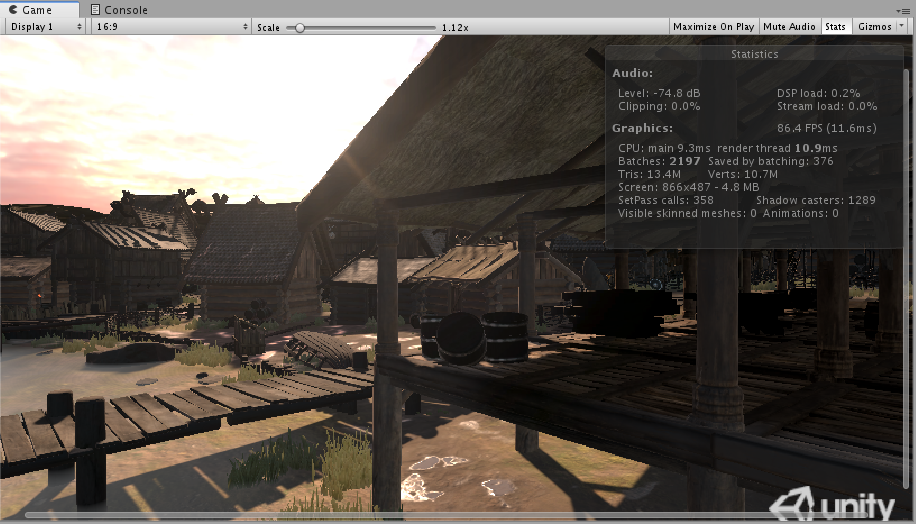
As you can see, the Statistics window contains quite a bit of information that’s displayed in two categories, Audio and Graphics.
The Audio section contains four important pieces of information about the current frame of the Scene (Figure 02).
- Level: The current sound decibel. If the audio is muted, you’ll see (MUTED) next to the decibel level.
- Clipping: The percentage of audio distortion happening within the view.
- Stream load: The total load of the audio stream.
- DSP load: The total load of the DSP buffer.
The Graphics category of the overlay contains information about a given frame (Figure 03).
- FPS: The amount of time it takes to process and render one frame. This does not account for the time it takes to draw the Scene view, Inspector, and other Editor-only processing.
- CPU: The time spent on the CPU and its rendering thread.
- Batches: This is the batches where the engine attempts to combine the rendering of multiple objects into a chunk of memory in order to reduce CPU overhead due to resource switching.
- Tris: The number of triangles drawn.
- Verts: The number of vertices drawn.
- Screen: The size of the screen along with the anti-aliasing level and memory usage.
- SetPass calls: The number of rendering passes.
- Shadow casters: The number of shadow-casting objects within the view.
- Visible skinned meshes: The number of skinned meshes rendered in the frame.
Animations: The number of animations playing.
2. Conclusion
The Stats overlay provides real-time feedback and statistics on your project. It’s a quick glance at what’s happening in the current frame and will help you pinpoint locations within the project that may be causing performance problems and should be further investigated within the Profiler window.