
Understanding Shader Graph
Tutorial
intermediate
+33XP
25m
(32)
Unity Technologies
In this tutorial, you'll learn about Unity's Shader Graph tool and how to navigate its interface. You'll explore the Shader Graph window and its key areas: the Toolbar, Blackboard, Workspace, Main Preview, Master Stack, and Graph Inspector. You'll also learn about nodes and properties, the building blocks of shader creation. By the end of this tutorial, you'll be comfortable navigating Shader Graph and be ready to start building your own shaders.
By the end of this tutorial, you'll understand the following:
- What Shader Graph is and why it's useful for shader creation.
- How to navigate the Shader Graph window and its components.
- The purpose of each area: Toolbar, Blackboard, Workspace, Main Preview, Master Stack, and Graph Inspector.
- How nodes and properties work together to create shader logic.
1. What is Shader Graph?
Shader Graph is Unity's visual shader authoring tool. Traditionally, if you wanted to create your own custom shaders, you’d need to manually create it using code in languages like HLSL (High-Level Shader Language). But with Shader Graph, you create shaders by connecting nodes in a graph-based interface. This makes shader creation accessible to artists, designers, and programmers alike.
Think of nodes as building blocks: each node performs a specific function, like sampling a texture, multiplying values, or applying a mathematical operation. By connecting these nodes together, you create the logic that defines how your shader works.
Shader Graph is a very powerful tool, but in some cases when creating very complex shaders you might need to create your own custom nodes or connect an HLSL script to your Shader Graph.
Important: To use Shader Graph, you need to check that the Shader Graph package is installed in your project. The package is already included in this course project’s assets, but if you’re working on your own project and don’t have it installed, follow these instructions on how to install a package via the Package Manager.
2. The Shader Graph window
We recommend you create a sample shader graph to follow the guidance in the next steps.
1. Create sample shader
- In the Project window, open the _GetStartedWithShaderGraph > Shaders folder.
- Right-click inside the Shaders folder and select Create > Shader Graph > URP > Lit Shader Graph.
- Rename the new shader graph “SampleShader”.
Note: You might get prompted with a dialog window asking you if Shader Graph assets should open upon creation. If so, select Yes before continuing.
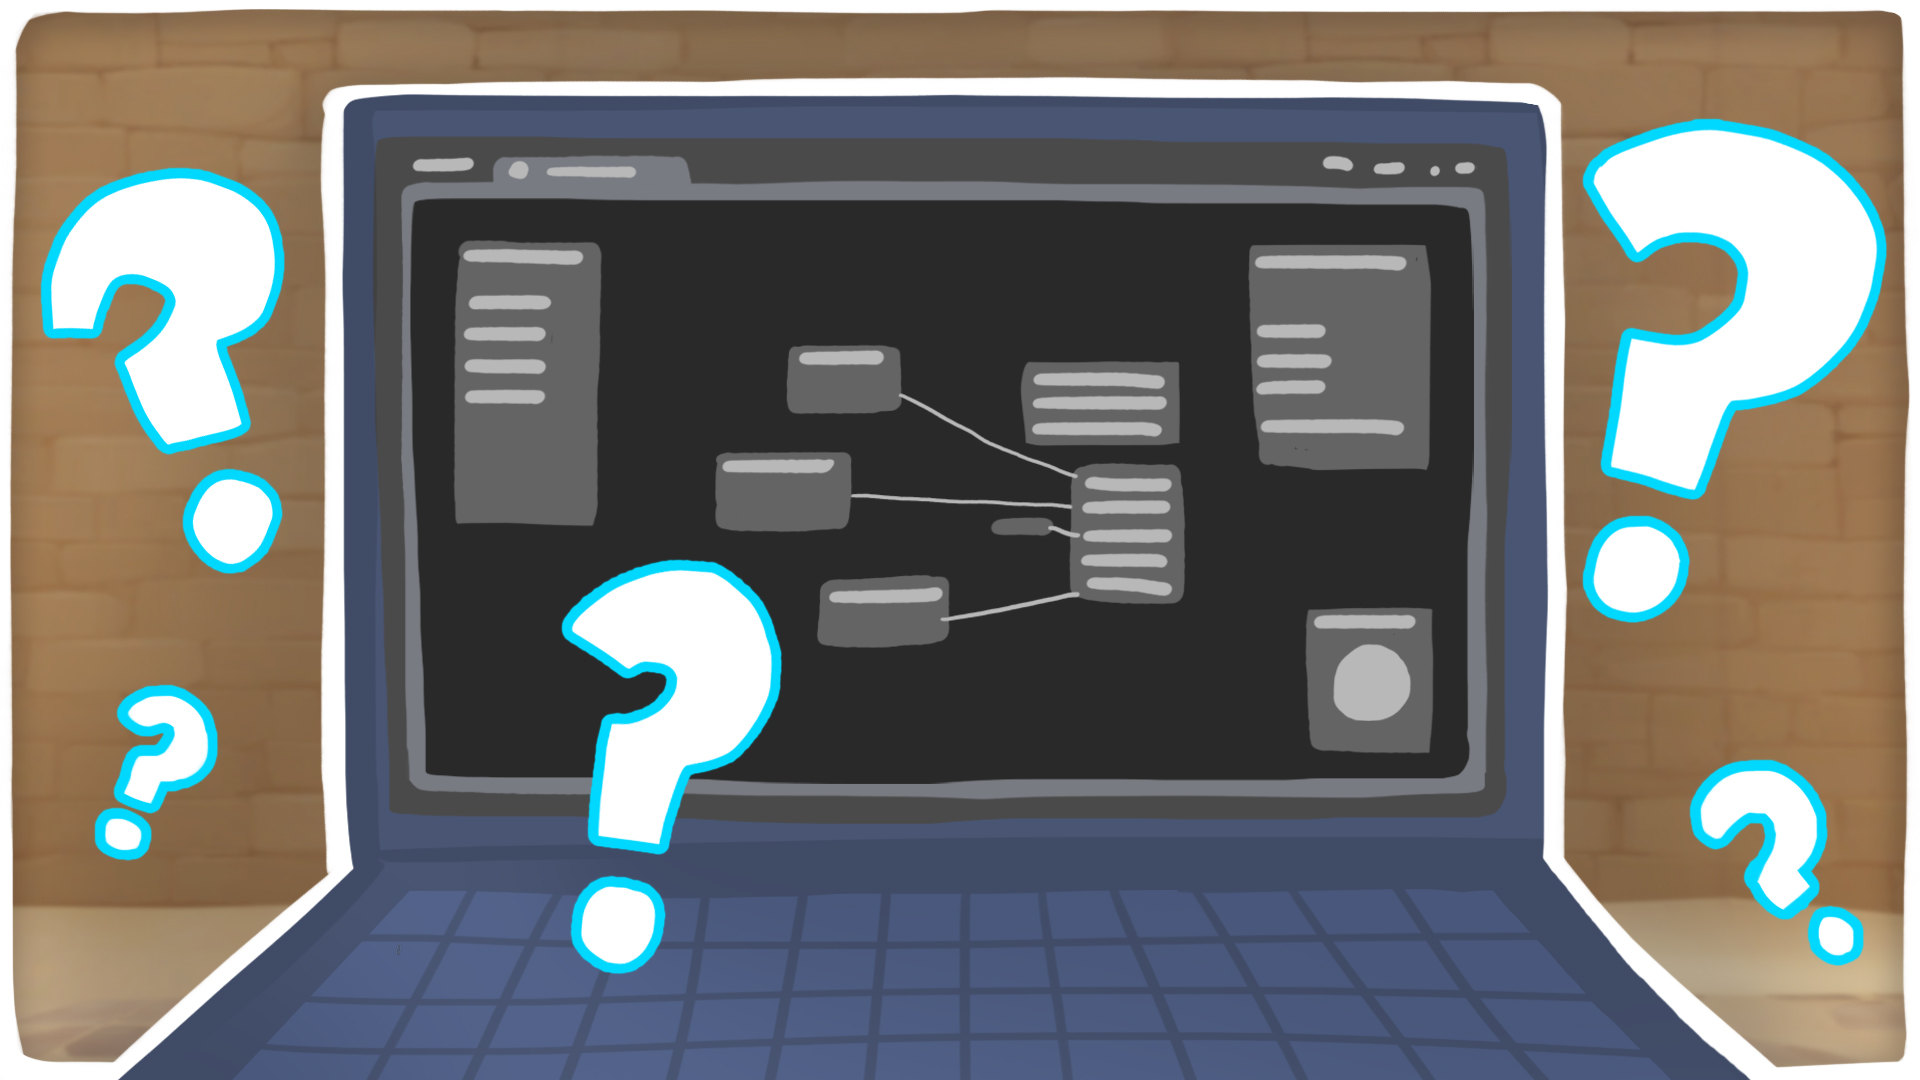
The Shader Graph window is where you build your shaders visually. It's a dedicated editor window that contains all the tools you need to create, edit, and preview your shader effects. The Shader Graph window is divided into several key areas:
Understanding these areas and how they work together is essential for working efficiently in Shader Graph. In the following steps, you'll explore each area in detail.
Note: The exact layout may vary depending on your Unity version and personal workspace arrangement, but all these elements will be present whenever you're working in Shader Graph.
3. Shader Graph Toolbar
The Toolbar is located at the top of the Shader Graph window and provides access to essential actions and settings you'll use throughout shader creation.
Key Toolbar functions include the following:
- Save: Saves your current shader graph. You can also use the shortcut Ctrl+S (macOS: Cmd+S).
- Show In Project: Highlights the shader file in the Project window.
- Activate/Deactivate areas: On the right side, you’ll find three buttons (Blackboard, Graph Inspector, and Main Preview) that enable or disable these areas when you select them.
- Open Shader Graph user manual: Opens the official Unity documentation for Shader Graph.
The Toolbar also displays the name of your shader graph file, helping you confirm which shader you're currently editing.
Tip: Get in the habit of saving frequently (Ctrl+S (macOS: Cmd+S)) as you work.
4. The Blackboard
The Blackboard is by default located on the left side of the Shader Graph window. This is where you define properties that can be adjusted in the Inspector window and reused throughout your shader.
Properties defined in the Blackboard become adjustable parameters in any material that uses your shader. For example, if you create a Tint Color property in the Blackboard, anyone using a material from the shader can change that property in the material’s Inspector window without modifying the shader itself.
Key Blackboard features include the following:
- Add Property: Create new properties for your shader.
- Property Types: Different data types for different purposes (colors, floats, textures, etc.).
The Blackboard is essential for creating flexible, reusable shaders. Instead of hardcoding values directly into nodes, you create properties that can be adjusted per-material, making your shaders more versatile and easy to modify.
5. The Workspace
The Workspace is the large, central area of the Shader Graph window. This is where you'll spend most of your time building shader logic by placing and connecting nodes.
The Workspace functions like a canvas where you can do the following:
- Place nodes: Right-click or press Spacebar to open the Create Node menu. Then, move them around to arrange them clearly.
- Connect nodes: Click and drag from a node's output port to another node's input port.
- Group nodes: Group nodes together by selecting them and right-clicking and selecting Group selection to organize your shader logic clearly.
- Redirect connections: Select a connection between two nodes, right-click and select Add Redirect Node. This creates a subdivision in the connection line that you can move to organize the graph more clearly.
- Navigate: Middle-click and drag, or hold Alt (macOS: Option) and left-click and drag to pan around. Scroll to zoom in and out.
- Focus: Press the F key to focus on the node or node group you have selected. Press the A key to zoom out and frame the entire logic you have created.
Nodes are connected by lines (called edges or connections) that show the flow of data through your shader. Data flows from left to right: from output ports on the left side of nodes to input ports on the right side of other nodes.
As your shaders become more complex, keeping your Workspace organized is important. Group related nodes together, use straight connection lines when possible, and don't be afraid to spread things out for clarity.
Tip: If you're using a trackpad, you can pan by holding Alt (macOS: Option) and dragging with the left button.
6. Main Preview window
The Main Preview window is typically located in the lower-right of the Shader Graph window. This preview shows a real-time, 3D visualization of your shader as you build it.
The preview is incredibly useful because it updates automatically as you work. Every time you connect a node, change a value, or modify your shader graph, the preview immediately reflects those changes. This instant visual feedback helps you understand what each node does and how your shader is developing.
Click and drag in the preview to rotate the model and view the shader from different angles.
Important: If at any time you notice that the Main Preview is not working properly or not updating in real time with your changes, first check your node connections. If everything looks correct, save your changes using Ctrl+S (macOS: Cmd+S), close the Shader Graph window of the shader, and then reopen it.
Change the preview model
To change the preview model, right-click over the Main Preview window. You can then select one from several mesh options like a Sphere, Cube, or even your own models that you’ve imported to the project.
Different preview models help you test how your shader behaves on various surface types. For example, a texture might tile perfectly on a plane but stretch awkwardly on a sphere.
Throughout this course, you'll use the Main Preview window constantly to verify your shader is looking as expected before applying its material to GameObjects in your scene.
7. The Master Stack
The Master Stack is typically located on the right side of the Workspace. This is where your shader's logic ultimately connects. The Master Stack defines the final output and determines how Unity renders your material.
The Master Stack is divided into two sub-stacks: the Vertex and Fragment stacks, as mentioned in the Course Introduction tutorial. Each sub-stack is in charge of changing different aspects of the geometry. Each sub-stack can contain several block nodes that control different aspects of your shader's appearance, for example:
- Vertex Stack:
- Position: The vertex position in object space.
- Normal: The vertex normal in object space.
- Tangent: The vertex tangent in object space.
- Fragment Stack:
- Base Color: Determines the color of the surface.
- Alpha: Controls transparency (if transparency is enabled).
- Emission: Makes the surface glow or emit light.
Important: If your sub-stacks are empty or not all block nodes mentioned are visible by default, you can add or remove blocks depending on what properties your shader needs.
Adding and removing blocks
1. To add a block:
- Right-click over the Vertex or Fragment Stacks.
- Select Add Block node to see a list of available blocks.
- Select the block you want to add.
2. To remove a block:
- Select the block node you want to remove.
- Right-click and select Delete it to remove it.
Note: Only blocks that have connections actually affect your final shader. An unconnected block won't do anything, but it's still good practice to remove blocks you're not using to keep your graph clean.
Remember, the Master Stack is where everything comes together. All the node networks you create in the Workspace need to ultimately connect to the Master Stack to produce the final rendered result.
Tip: You can right-click any Block node and select Open Documentation to open Unity’s official documentation.
8. Graph Inspector window
The Graph Inspector window is typically located on the right side of the Shader Graph interface.
The Graph Inspector consists of two sections:
- Node Settings: When you select a node, this section displays the attributes and configuration options specific to that node type.
- Graph Settings: While your nodes define the logic of your shader, the Graph Settings control the global shader properties that affect how Unity renders the material. Some Graph Settings you’ll use during this course include the following:
- Material: When you first create your shader graph, you choose this attribute (Lit, Unlit, Sprite, etc.). It defines the default rendering settings for materials that use this shader, such as how the shader interacts with lighting, transparency, and rendering.
- Surface Type: Choose between Opaque (non-transparent) and Transparent (see-through).
- Render Face: Determines whether Unity renders the front, back, or both sides of a surface.
- Exposed vs Hidden: You can choose whether a property appears in the Inspector window or not.
When you create a property, by default it’s set to Exposed. After saving the shader and returning to the Inspector window, you’ll see that property available in the material’s Inspector window, where its values can be adjusted for that material.
These settings affect the technical rendering behavior of your shader. For example, if you're creating a glass material, you'd set Surface Type to Transparent. If you're creating a double-sided fabric, you'd set Render Face to Both.
You don't need to fully understand all these settings right now. As you create different shader types in this course, you'll learn when and why to adjust specific Graph Inspector settings for different effects.
9. Understanding nodes and properties
Nodes are the fundamental building blocks of Shader Graph. Every shader you create is made by placing nodes in the Workspace and connecting them together to create logic.
Node structure
Each node has the following structure:
- Inputs (on the left side): Where data enters the node
- Outputs (on the right side): Where processed data exits the node
- Parameters (in the middle): Settings specific to that node. However, not all nodes have exposed parameters that you can edit.
Data flows through your shader graph from left to right. You connect a node's output port to another node's input port, passing data along the chain until it reaches the Master Stack.
Data types of node inputs and outputs
Node inputs and outputs indicate the type of data they use in two main ways: First, through color coding. Different colors represent different data types, such as colors, floats, or vectors. Second, through a number that indicates the size of the data. For example, a Color node has (4) in its output because it returns an output with four channels (RGBA), while a Vector2 node has (2) in its output because it returns only two values.
This is important because some nodes require inputs of a specific type and size to perform their operations correctly. These visual cues help you quickly understand and track what kind of data is flowing through your nodes.
Important: Not all nodes can be connected to each other. Connections depend on whether the output of one node and the input of the other node use compatible data types. In some cases, Shader Graph can automatically convert between compatible types (for example float (1) > vector2 (2)).
Node preview
Some nodes, such as Multiply, Add, or Position, include a small preview window that displays the result of the node’s output. This preview helps you visually understand the type of data the node is producing while you build your shader.
When the output of a node is a vector value, Shader Graph visualizes its components as colors in the preview. In these previews, the X component is represented as red and the Y component as green. When both components are active at the same time, the colors combine and appear yellow, and when both values are zero the preview appears black.
These previews are useful for quickly identifying how values are changing and which vector channels are active as data flows through the graph.
Important: The preview color is used for visualization inside the node preview and does not directly represent the actual color that the shader will render.
Converting nodes to properties
Sometimes while building a shader, you may realize that certain nodes would be better exposed as a property that can be adjusted in the Inspector window. Instead of deleting the node and creating a new property, you can convert the node directly into a property.
1. Convert a node value to a property
- Right-click on the specific property or value field on the node.
- Select Convert to > Property from the context menu.
- The value is now added to the Blackboard as a new property.
- The node automatically connects to this new property.
Converting the node into a property adds it to the Blackboard, and makes it now accessible in the material’s Inspector window.
10. Next steps
Congratulations!
You've completed this tutorial. You now understand how to navigate the Shader Graph window and each one of its components. You’ve completed Unit 1 and are ready to start creating your own Shader Graph assets in the next unit.
You’ve also completed this unit and learned the basics of shaders and Shader Graph. This unit is part of the Get Started with Shader Graph course, which is organized into multiple units that explore different shader techniques, we encourage you to check out our other units.