Debugging and Testing the Input System
Tutorial
·
Beginner
·
+0XP
·
20 mins
·
(266)
Unity Technologies
For this tutorial, you will follow a step by step process of how to debug your inputs. This will show you the various areas you can troubleshoot your input and how to work with them
1. Debugging Devices
To get started, open the Input Debugger by selecting from the top menu dropdown:
Window > Analysis > Input Debugger.
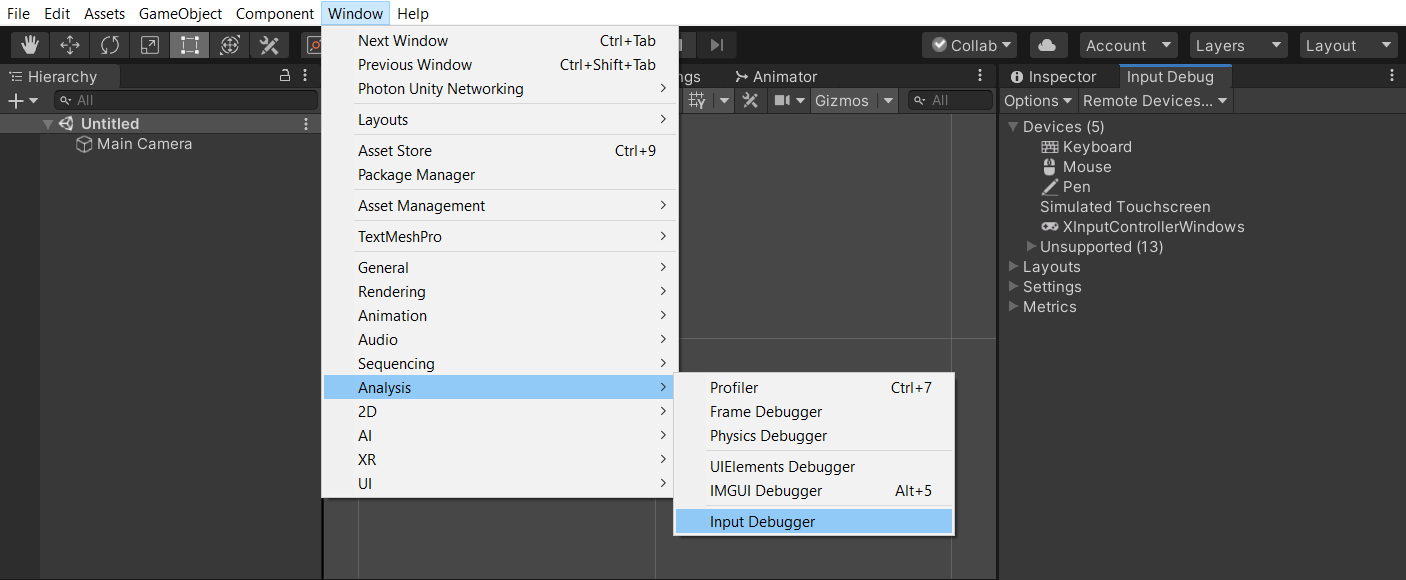
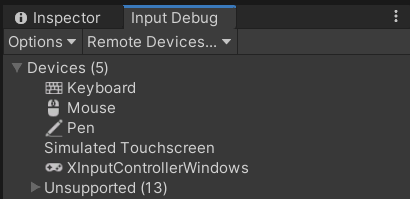
In the Devices list of the Input Debugger, a list of all Input Devices currently in the system are displayed, along with a list of unsupported/unrecognized devices.
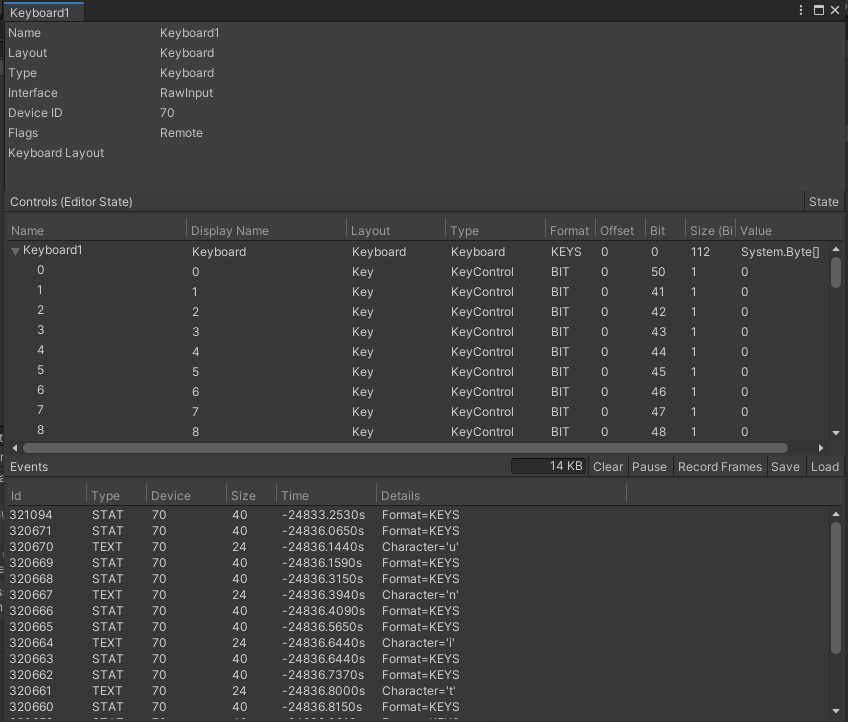
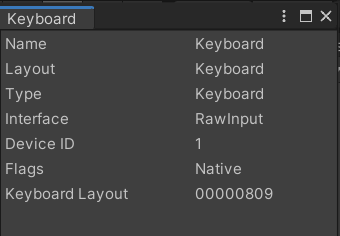
1. Double-click on a Keyboard or Gamepad device displayed in the list of devices. This opens a window that displays information about the device, including real-time state information.
2. The top of the device window displays some information about the device itself, it’s useful to know your device's layout and interface as these can affect the way they need to be handled. For debugging purposes, you might need to check Device ID, Flags, and Keyboard Layout.
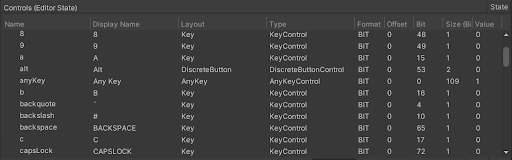
3. Below that is the Controls section, which displays the current Editor’s state. Make sure to verify that the input you’re debugging is what the Input System has paired correctly. For instance, on a UK keyboard, the input “backslash” is paired with the “#” key as they’re swapped on the American layout.
The Value column is useful as it shows the input states in real-time. Press any keys or button on your device and the value associated with it will change to 1 when pressed. Keyboard values are binary; however, with a controller’s D-Pad or analog stick, you’ll see a Vector2 for input.
4. At the bottom of the keyboard window is the Events section. Here is where you can see your real-time input events generated by your device. If you want to see the frames occurring with your inputs, click Record Frames.
Press two different keys to generate their data to the Events list. Two STAT rows will be created for each. The first is your actual input and the second is resetting the values back to their unpressed state. If you are using Keyboard, a TEXT row will also appear, detailing the key pressed.
5. Now that you have some input logged, hold CTRL, and select the first STAT row in each pair. Now right-click one of the selected inputs and select Compare on the context menu.
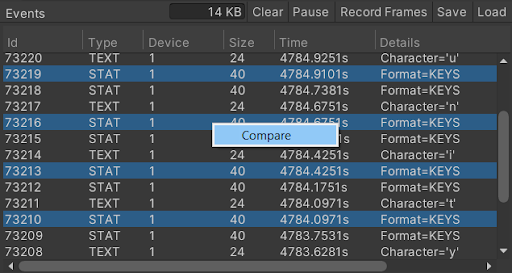
This opens a new Keyboard window which by default has Show Only Differences selected. You can compare your inputs here to see the differences between them.
6. Click Save on the top bar of the Events section to save your recorded input. This will save as a .inputtrace file, which can be loaded in by anyone with the Load button.
2. Debugging Actions
The Input Debugger lists all enabled actions in the Actions list. It can be used to debug whether your bindings are set up correctly. Note: Actions that belong to InputUsers won’t appear in the Actions list. Instead, they are listed under Users. The next section of the tutorial shows how to debug users. The Actions section will not appear in the Input Debugger unless two criteria are met:
- The Editor is in Play mode.
- There is at least one Action enabled.
To get you set up with the minimum requirements needed to be able to debug actions, follow the instructions below:1. Create an empty GameObject by selecting GameObject > Create Empty, then rename it to “Action Example”.2. In the Project window, make a new script by right-clicking and selecting Create > C# Script and name it “InputDebuggerActionExample”.3. Open the script you just created, delete all lines of code inside and paste in the following code:
using UnityEngine;
using UnityEngine.InputSystem;

public class InputDebuggerActionExample : MonoBehaviour
{
    public InputAction exampleAction;

    void OnEnable()
    {
       exampleAction.Enable();
    }
}
This is the minimum amount of code you need to get an action to display in the Input Debugger. Add this script to your Action Example GameObject. Now when you click Play, the Actions section will appear in the Input Debugger, and an Example is listed inside of it.
Note: The word Action is removed from the end of Action names in the Input Debugger.
4. Exit Play Mode. On the Action Example GameObject, you created and added the InputDebuggerActionExample script to, your InputAction is displayed as it’s set to Public in code. Select the + button on the right of it and select the Add Binding option. A <No Binding> row will appear in the ExampleAction section.
5. Double-click on the <No Binding> row to open its set-up menu. In the path section, add a Keyboard or Gamepad input. For the sake of this tutorial, it doesn’t matter what you choose as it’s just an example.
6. Repeat Steps 4 and 5 but use a different device’s binding path.
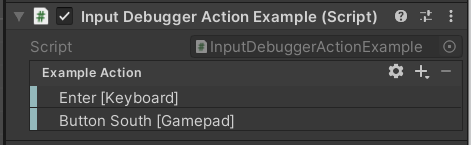
7. Now when you click Play, the Actions list will display both of your Actions.
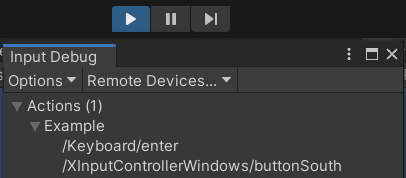
Using the Actions list in the Input Debugger makes it easy to check what Actions are enabled and what inputs are bound to the actions.
3. Debugging Users and PlayerInput
When you create InputUser instances the Users list will display them in the Input Debugger when the Editor is in Play mode. If you use PlayerInput components, they each will implicitly create an InputUser instance. Inside each User listed is their Control Scheme along with Paired Devices and Actions. These work the same as the general Devices and Actions lists, except the User versions are specific to the User. This allows you to debug input per specific players, who might be using different methods of input, such as different Gamepads. The Users list will not appear in the Input Debugger unless two criteria are met:
- The Editor is in Play mode.
- There is at least one Input User instance.
To get some InputUser instances so you can see them in the Input Debugger, follow these steps:
1. Create an empty GameObject with GameObject > Create Empty, and then rename it to “Player 1”.
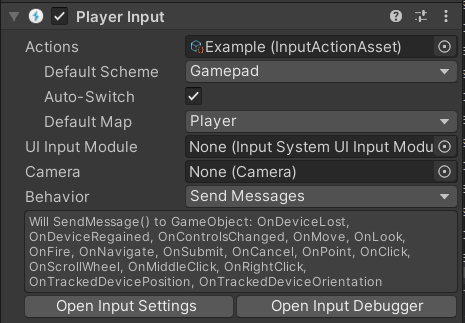
2. Select Add Component at the bottom of the Inspector on Player 1 and then navigate to Input > Player Input.
3. Select Create Actions… on the PlayerInput component and save the .inputactions file to your Assets folder.
4. Insert your new Input Actions Asset into the Actions field.
5. In Default Scheme select Gamepad. If you don’t have a Gamepad or any other alternatives to Keyboard&Mouse, select Keyboard&Mouse in this step and skip to Step 8.
6. Right-click your Player 1 GameObject in the hierarchy and select Duplicate in the context menu.
7. Rename your duplicate to “Player 2”
8. In Player 2’s PlayerInput component, change the Default Scheme to Keyboard&Mouse.
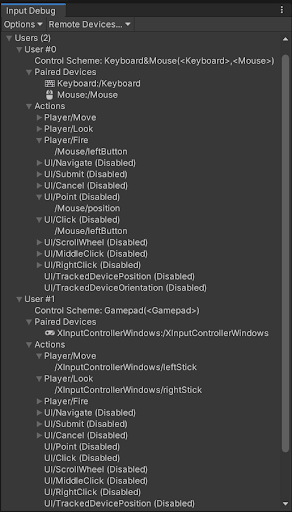
9. Click Play, in Input Debugger you’ll now see the Users list which displays two users with separate Control Schemes. They have different Paired Devices and Actions. You can double-click on a User’s Paired Device to open up the device window, just like in the Devices list.
4. Debugging Layouts
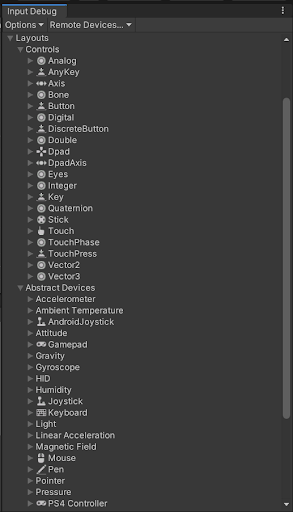
The Layouts list in the Input Debugger window displays a breakdown of all registered Controls and Devices layouts. This is the database of supported hardware and the knowledge of how to represent a given piece of input hardware. It's useful when you want to create a new Device mapping and see how the Input System represents it.
5. Debugging Remotely
The Input Debugger can remotely connect to a Player that is running a build of the project. This makes it possible to observe input activity from the Player in the Editor. This connection uses the PlayerConnection mechanism, which is also used in the Profiler and Console.
Debugging remotely is limited to seeing Player Devices and subsequently Player Input Events.
To see Input remotely, follow these steps:
1. In File > Build Settings, make sure you have Development Build enabled. This feature is only for development builds.
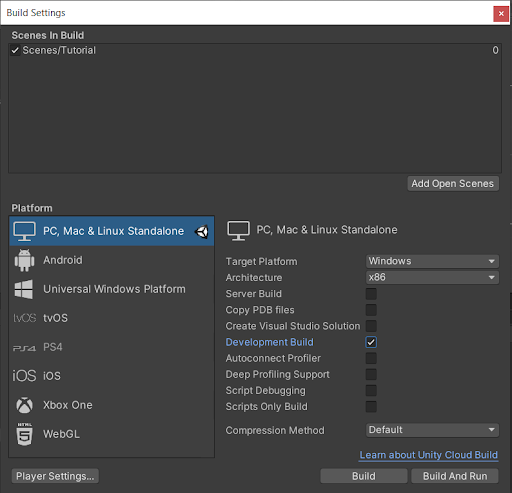
2. Build and Run a project that has the Input System package installed.
3. Open the Editor side-by-side with the running application.
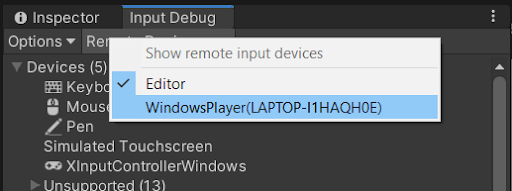
4. In Input Debugger, open the Remote Devices… dropdown and select your device on the list.
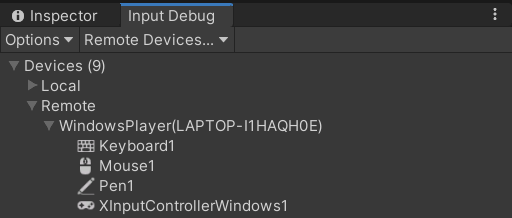
5. Devices are now split into two lists, Local and Remote. In Remote, your device is listed.
6. Open the Remote Keyboard’s device window by double-clicking it.
7. Click on the running application to focus it and press any keys on your keyboard. The Events window displays real-time the input events occurring from the remote input on the external build.

6. Input Visualizers
The Input System package comes with a Visualizers sample. It provides various components which let you monitor the state of various Input System elements in real time using on-screen visualizers.
To install and add the Visualizers sample, follow these steps:
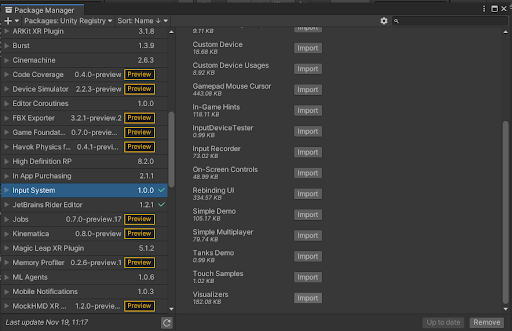
1. Open the Input System in the Package Manager by selecting from the top menu dropdown: Window > Package Manager > Input System.
2. In the Samples section of the Package’s page, select Import for the Visualizers sample.
Once this is installed, you’ll have the Visualizers sample installed in your project. There’s two components which can connect input to visualizers. This section of the tutorial will cover both.
The InputControlVisualizer connects to input bindings directly and doesn’t require any Actions.
1. In your Project scene, select GameObject > Create Empty to create an empty GameObject.
2. Rename your empty GameObject to “Input Control Visualizer”.
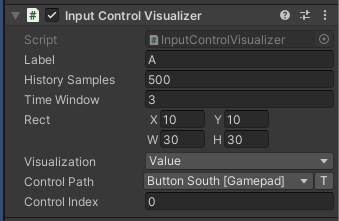
3. Select Add Component and select Input > Debug > Input Control Visualizer.
4. Set the W in Rect to 30.
5. Set the Visualization to Value.
6. In the Control Path dropdown menu, select a button from a Gamepad or key on a Keyboard you’d like to visualize.
7. In the Label field, add a label that is appropriate with the control you’re testing.
8. Click Play and click on the Game window to focus it.
9. Press your Control Path’s assigned button or key, this will cause the visualizer to light up with a 1 next to it.
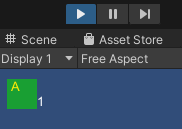
10. While the Editor is still in Play mode, change the X and Y variables to move the visualizer around the screen. Also change the W and H variables to increase and decrease the width and height of the visualizer.
11. Finally, change the Control Path to different bindings. Some interesting visualizations you can try out are Gamepad’s Left or Right Stick and the Left or Right Trigger. You can also try the mouse’s Click Count, Delta and Position.
With this knowledge, you can now create a Visualizer for any Control Path. These are good for quick troubleshooting or small projects, but for longer term solutions, you might choose to create Visualizers for your Actions, which can reduce a lot of the work. This can be done with the InputActionVisualizer component.
7. Input Action Visualizers
The InputActionVisualizer is very similar to the InputControlVisualizer but requires Actions instead of Control Paths. The benefit of this is that referencing an Action allows for the Visualizer to represent multiple types of inputs, as Actions can be assigned multiple controls and inputs. For instance, a movement Action could be set up for both a gamepad and keyboard. With the InputControlVisualizer, you’d have to manually configure a Visualizer for the gamepad’s left stick and also for each keyboard arrow key or WASD key. With an InputActionVisualizer, the Input Action Asset could have the gamepad’s left stick and both the keyboard’s arrow keys and WASD keys all binded to one action. This way you can have your Visualizer connected to multiple sources of input.
Follow these steps to set up your Actions with Visualizers:
1. You’ll need an Input Action Asset, if you don’t have one, you can create one by following this tutorial.
2. In your Project window, right-click to select: GameObject > Create Empty to create an empty GameObject.
3. Rename your empty GameObject to “Input Action Visualizer”.
4. Select the Add Component button in the Inspector, and select: Input > Debug > Input Action Visualizer.
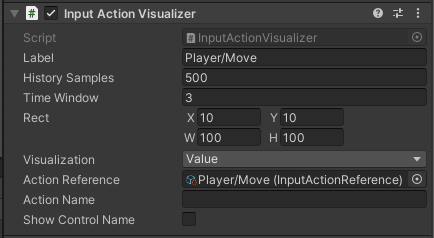
5. Set the W and H in Rect to 100.
6. Set the Visualization to Value.
7. For the Action Reference, add an Action from your Input Action Asset. If you are using the Input Action Asset from Step 1, add the Player/Move Action. Alternatively, you can type the Action’s name into the Action Name field (“Player/Move”).
8. Fill the Label field appropriately. if you chose the Action Player/Move then label the visualizer “Player/Move”.
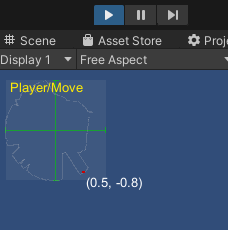
9. Click Play and click on the Game window to focus it.
10. Press the controls assigned to your Action. If you chose the Player/Move Action, use the Gamepad Left Stick or the W A S D / Arrow Keys on the keyboard. If you have a Gamepad you’ll notice that you can go between the Gamepad and Keyboard, the Visualizer is only listening to the Action.
11. Finally, change the Action Reference/Action Name to different Actions. If you don’t have a Gamepad, you can test out mouse and keyboard inputs bound to the same Action (eg. copy and paste the WASD keyboard controls for Player/Move into Player/Look).
Now that both types of Visualizers have been covered, you can now connect both Control Paths and Actions to Visualizers.
8. Input Testing
The Input System has built-in support for writing automated input tests. You can create input tests entirely from code, without any dependencies or platform backends and physical hardware devices. The system considers the generated input from the automated input tests you write to be the same as input generated at runtime by actual platform code.
9. Setting Up Test Assemblies
In the Packages/manifest.json file of your project, com.unity.inputsystem must be listed in testables. This is necessary for test code that comes with the package to be included with test builds of your project.
To start, check that you have this included.
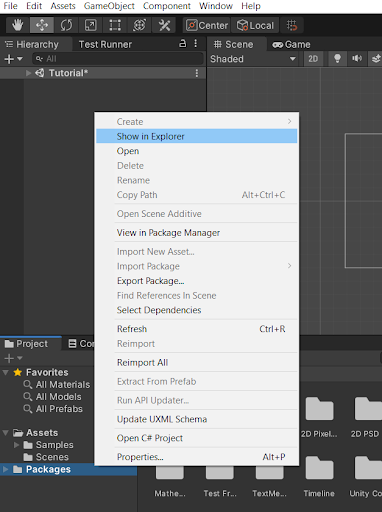
1. Select the Packages drop down in the Project window.
2. Right-click Packages.
3. Select Show in Explorer in the context menu.
4. Inside Packages, open the manifest.json file.
5. Ensure that under dependencies you have a “testables” section which includes “com.unity.inputsystem”. If you don’t, copy and paste it in with the following code:
{
"dependencies": {
// A list of your dependencies
},
"testables": [ "com.unity.inputsystem" ]
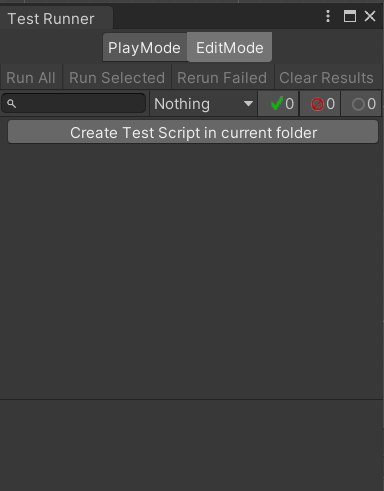
}6. Open the Test Runner window by selecting Window > General > Test Runner
7. In EditMode in the Test Runner window, select Create EditMode Assembly Folder.
8. Inside your new folder there is an Assembly Definition, select it.
9. In the Inspector, add two new references to the Assembly Definition References, add Unity.InputSystem and Unity.InputSystem.TestFramework.
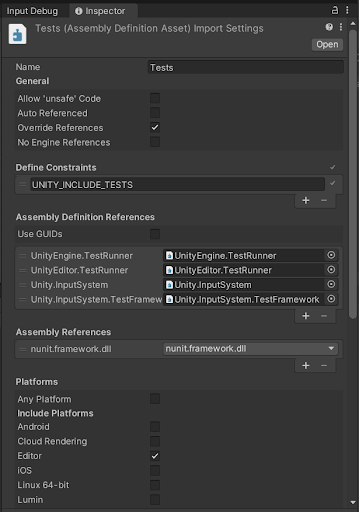
10. When finished, select Apply to apply the changes. The apply button can be found at the bottom of the Assembly Definition.
10. Setting Up Test Fixtures
Use InputTestFixture to create an isolated version of the Input System for tests. The fixture sets up a blank, default-initialized version of the Input System for each test, and restores the Input System to its original state after the test completes. The default-initialized version has all built-in registrations (such as layout and processors), but doesn't have any pre-existing Input Devices.
To start, the following will set you up with a test that adds a device and presses a button on it.
1. With a Test Assembly set up, open your Test Assembly’s Folder and select Create Test Script in current folder.
2. Open the new script file.
3. Add the following using statement at the top of the script:
using UnityEngine.InputSystem;4. Inherit your class from InputTestFixture. Your script should look something like this now:
using NUnit.Framework;
//Your using statements
using UnityEngine.InputSystem;

namespace Tests
{
    public class NewTestScript : InputTestFixture
    {
       //Your tests
    }
}
5. Inside your method with “[Test]” in the line before it, add the two following lines of code as seen inside this method:
[Test]
public void NewTestScriptSimplePasses()
{
        var gamepad = InputSystem.AddDevice<Gamepad>();
        Press(gamepad.buttonSouth);
}
You won’t need a Gamepad for a test on the Gamepad’s input to run. You can choose any device and input you want to test with this code by changing parameters.
Use InputSystem.AddDevice<T>() to add devices easily and to feed input, the easiest way is to use the Press(button), Release(button), PressAndRelease(button), Set(control,value), and Trigger(action) helper methods provided by InputTestFixture.
6. Return to Unity and select Run All in the Test Runner window.
7. Open up the dropdown menus and check if your test succeeded.
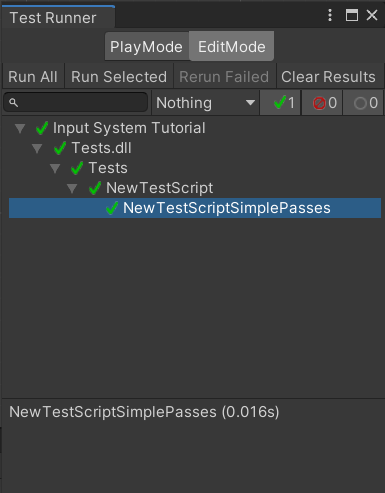
With this knowledge, you can further develop more Input Testing and automate your input. Without the need of physical devices, testing the Input System is quick and accessible. You can check out more advanced Input Testing code examples here.
11. Next Steps
With the completion of this tutorial, you’re ready to progress your debugging skills with the Input System. For starters, a lot more can be done with the input visualizers and input testing. You could create full layouts of your control schemes on-screen with the input visualizers to make a great development build interface. Additionally, you might develop some advanced tests with the input testing, such as simulating players changing between devices while playing. Finally, you will have seen lots of inspector fields that weren’t used in the tutorials, feel free to go back to these, experiment and read into them!